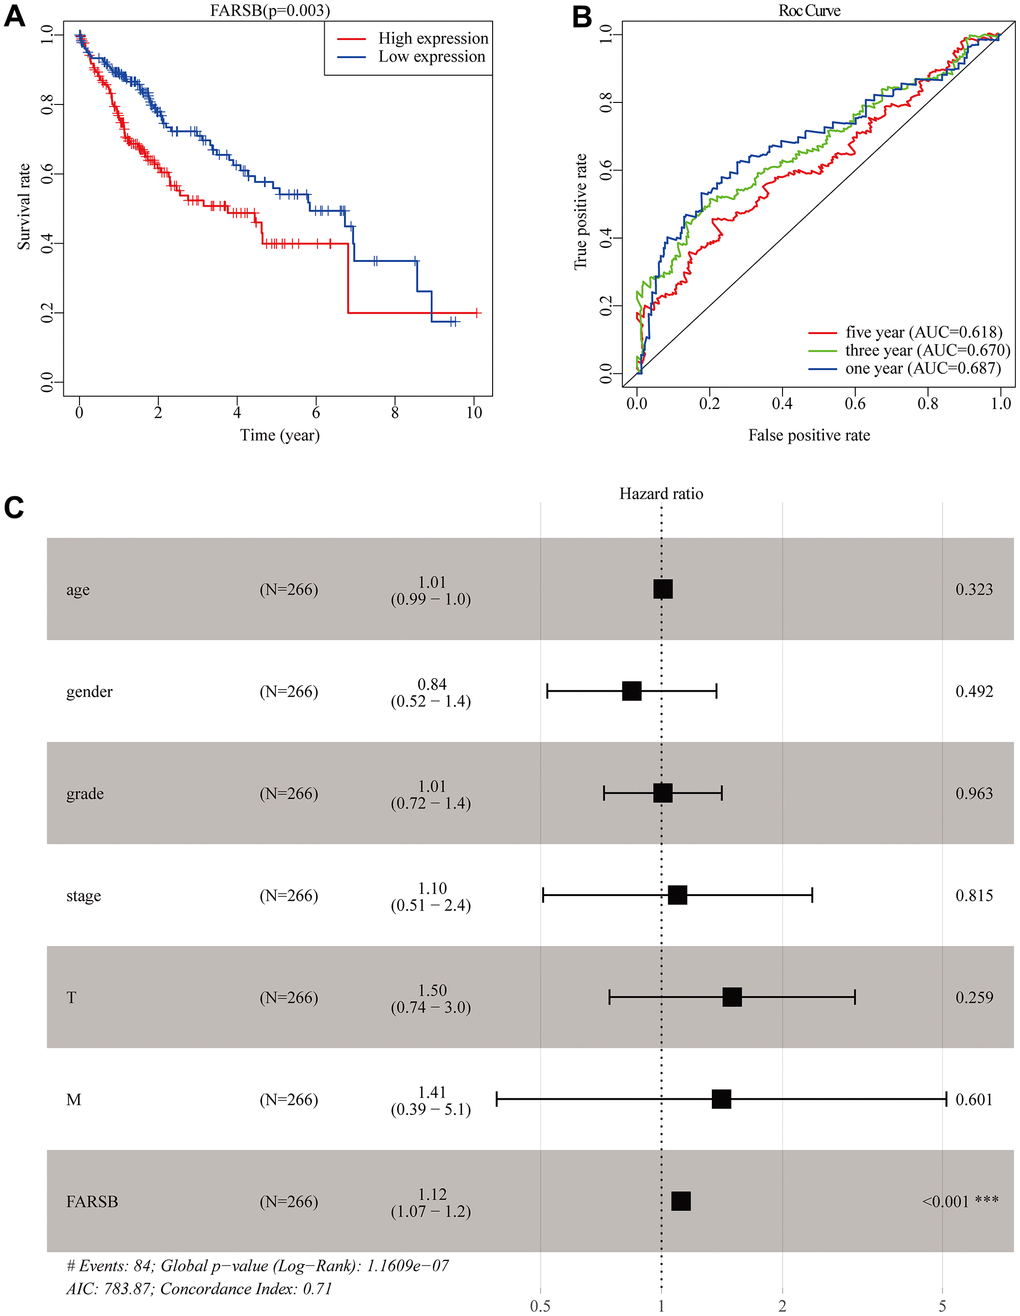
Figure 4.Construction of the prognostic model in TCGA cohort. (A) The Kaplan-Meier survival analysis for overall survival (OS) of patients in TCGA cohort. (B) The time-dependent ROC analysis for risk score in the TCGA cohort. (C) Forest plot of the univariate and multivariate Cox regression analysis in HCC regarding OS.