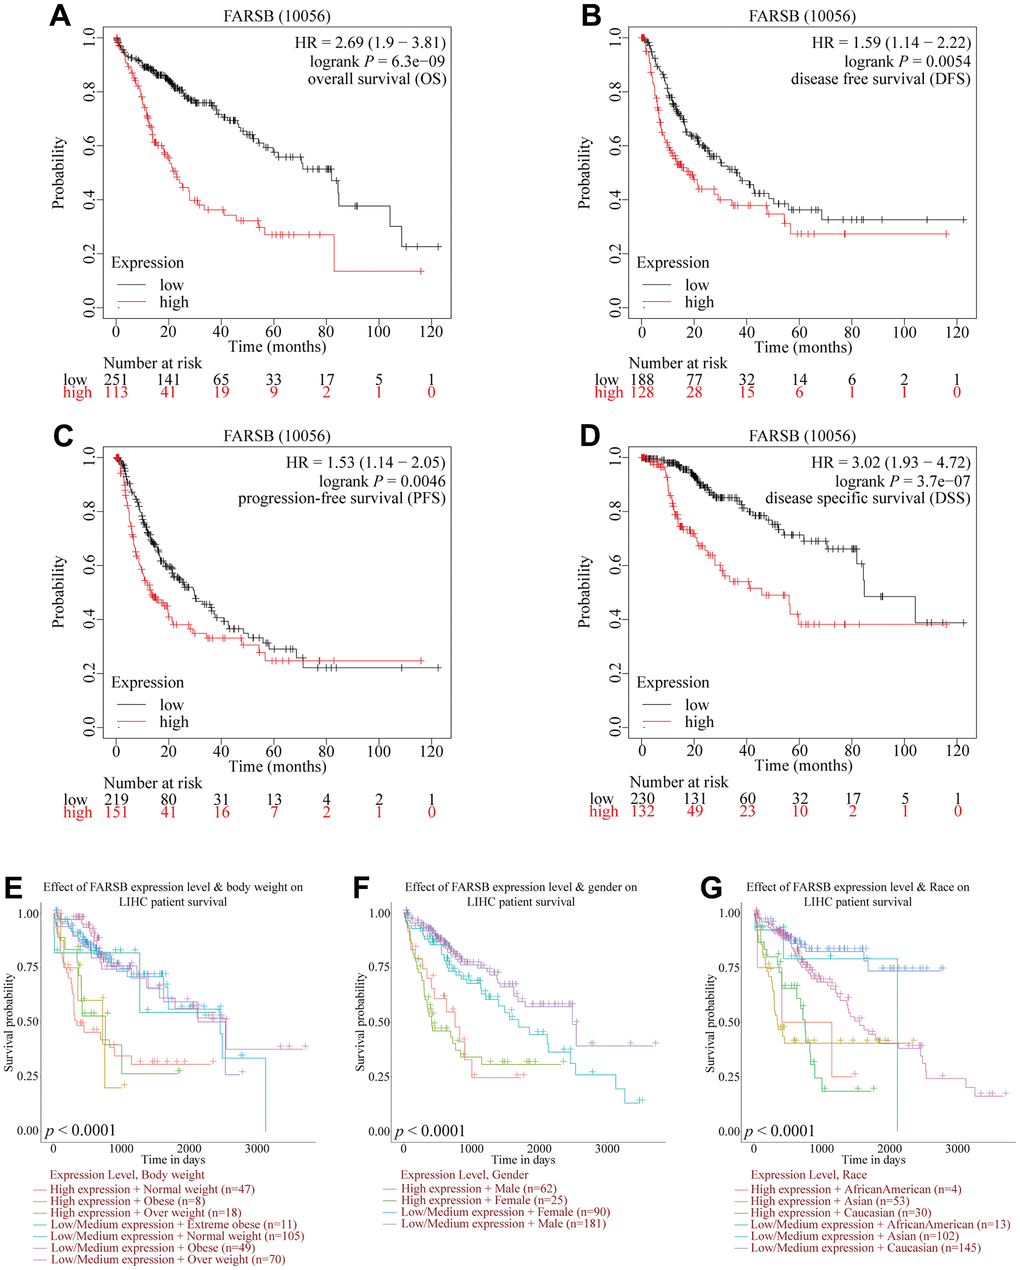
Figure 3.Comparison of survival curves of FARSB overexpression and underexpression in HCC. (A–D) Survival curves for OS, DFS, PFS, and DSS in normal and overall FARSB patients by using Kaplan-Meier Plotter. (E–G) Internal validation of the prognostic model in TCGA cohort based on clinical features by using UALCAN (E) BMI, (F) Gender, (G) Race.