Submit an Article
Navigate
Home
Editorial Board
Editorial Policies
Current Volume
Archive
Scientific Integrity
Publication Ethics Statements
Interviews with Outstanding Authors
Newsroom
Sponsored Conferences
Podcast
Contact
Special Collections
Submit an Article
Online ISSN: 1945-4589
Research Paper
|
Volume 15, Issue 6
|
pp. 2237–2274
A network meta-analysis of the efficacy of hypoxia-inducible factor prolyl-hydroxylase inhibitors in dialysis chronic kidney disease
Back to article
Figure 3
(3 of 5)
−
100%
+
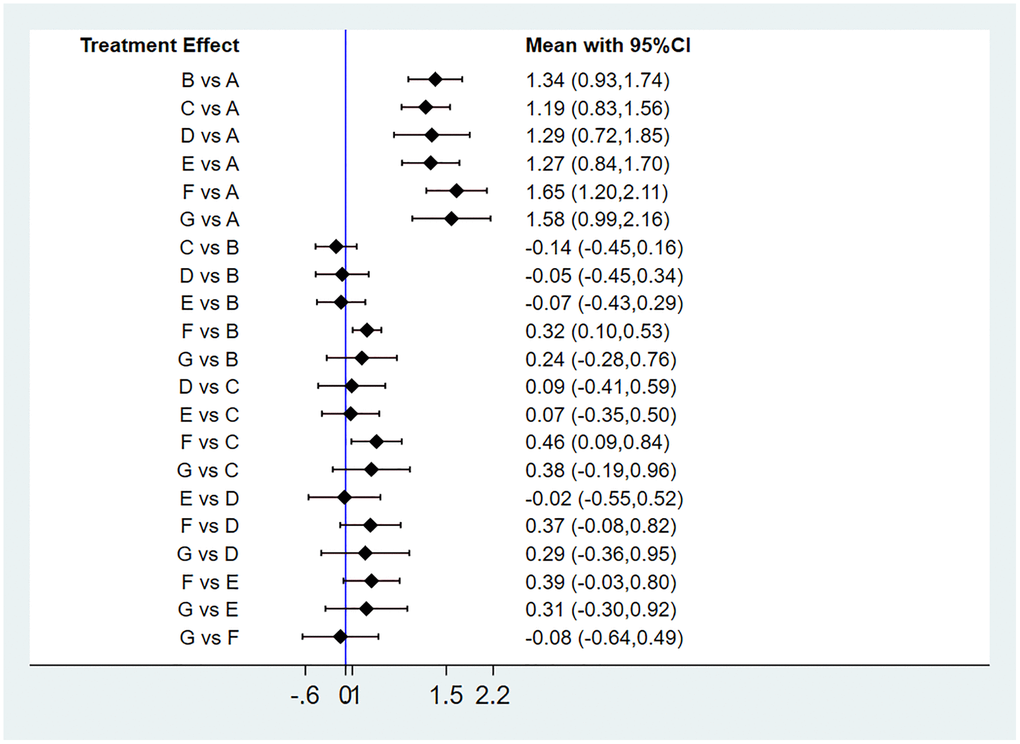
Figure 3.
Forest plot of hemoglobin levels.
Abbreviations: A: placebo/control; B: ESAs; C: daprodustat; D: molidustat; E: vadadustat; F: roxadustat; G: enarodustat.
Figure 3 — A network meta-analysis of the efficacy of hypoxia-inducible factor prolyl-hydroxylase inhibitors in dialysis chronic kidney disease | Aging