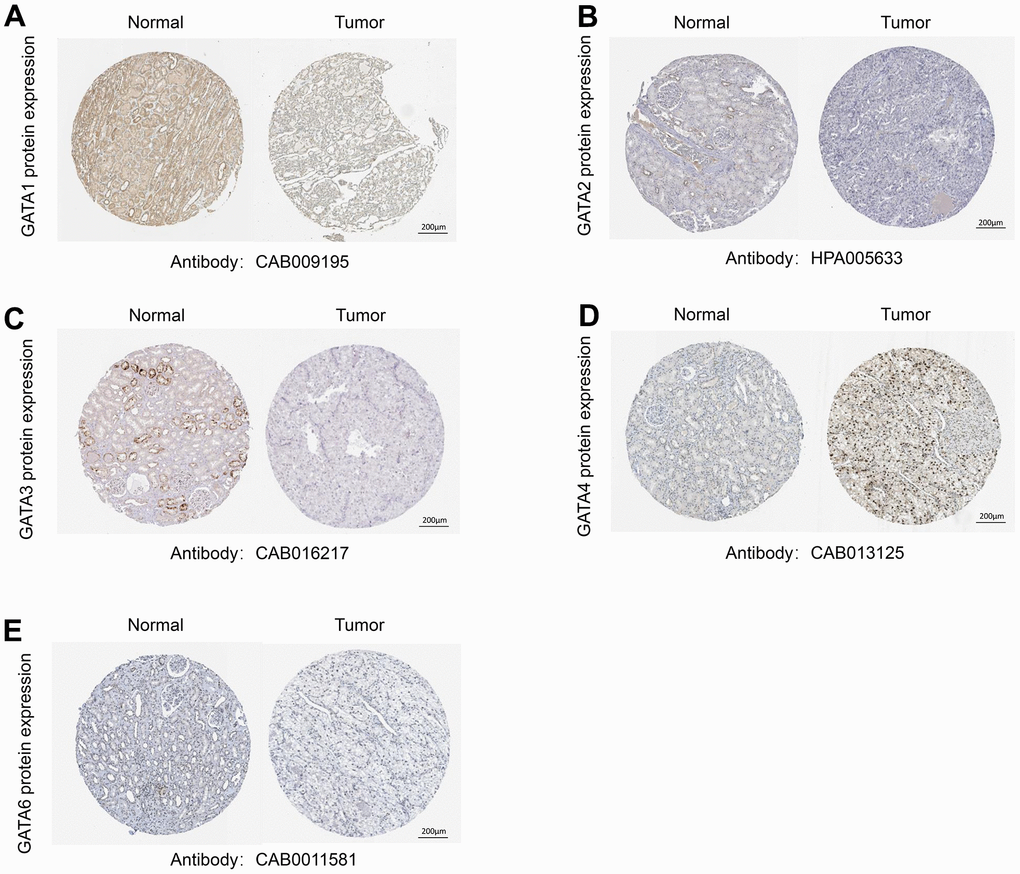
Figure 2.Representative immunohistochemistry images of the GATA family members. (A–E) The HPA database shows the protein expression levels of GATA1-6 in KIRC tissues compared with those in non-cancerous tissue. HPA, Human Protein Atlas; KIRC, kidney renal clear cell carcinoma.