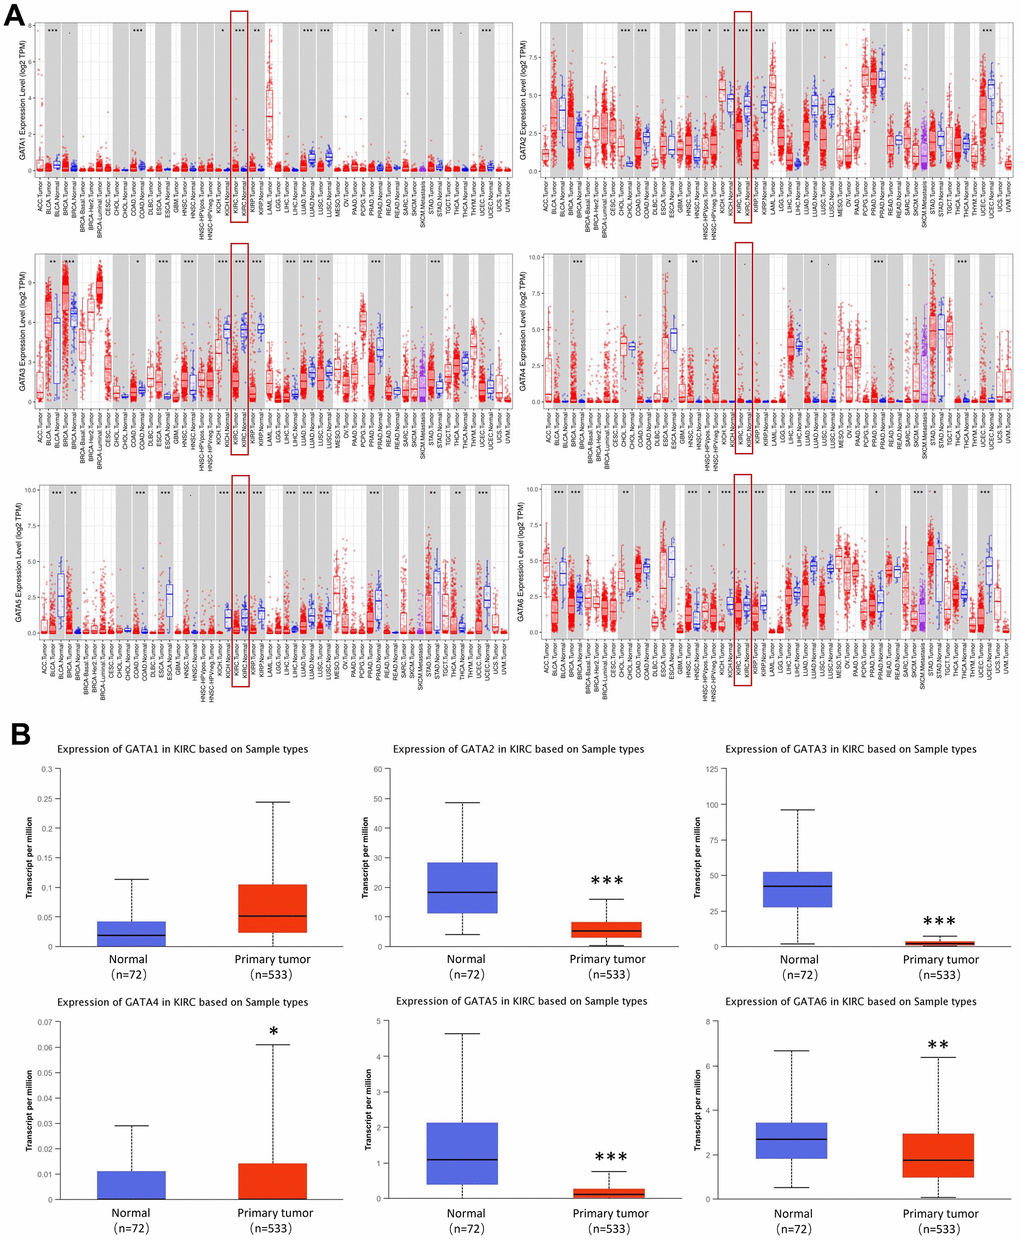
Figure 1.Expression levels of GATA family members in KIRC. (A) The pan-cancer expression of GATA1-6 mRNAs. (B) The expression of GATA mRNAs in KIRC. *p < 0.05, ** p < 0.01, *** p < 0.001 compared with control. KIRC, kidney renal clear cell carcinoma.