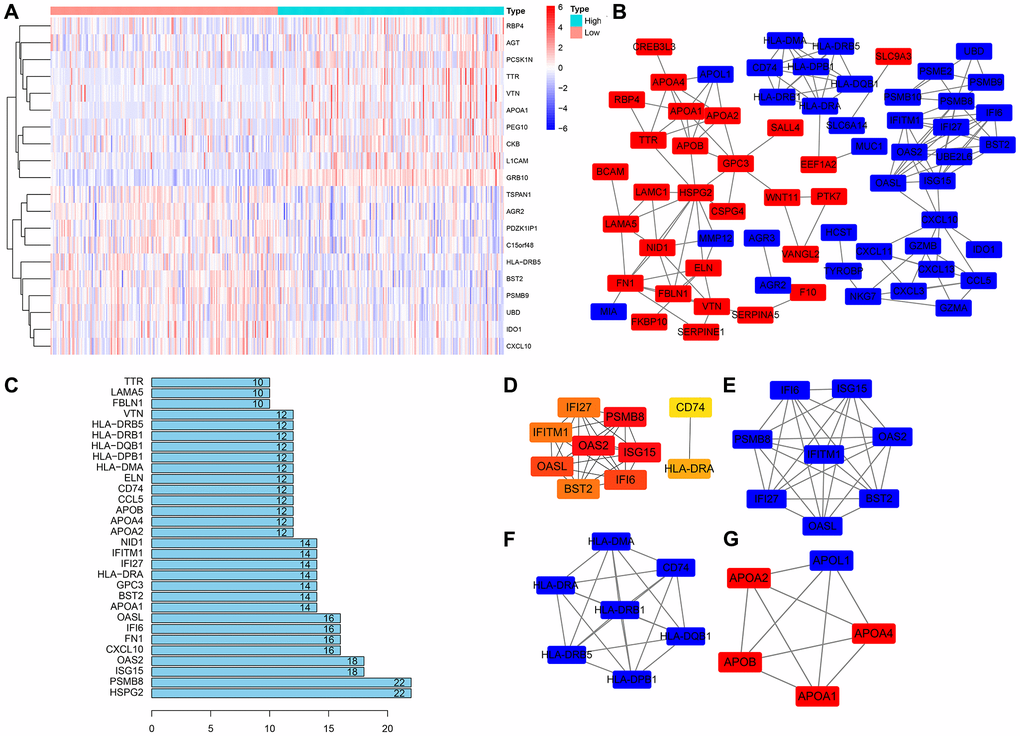
Figure 4.Construction of the PPI network and module analysis of GRB10. (A) The heatmap of top 10 co-expressed genes with GRB10. (B) PPI network was constructed using Cytoscape software. (C) The top 30 nodes in the number of edges of the protein-protein interaction network node from the string database. (D) The hub genes were identified using Cytoscape. (E–G) The core sub-network of the protein-protein interaction network.