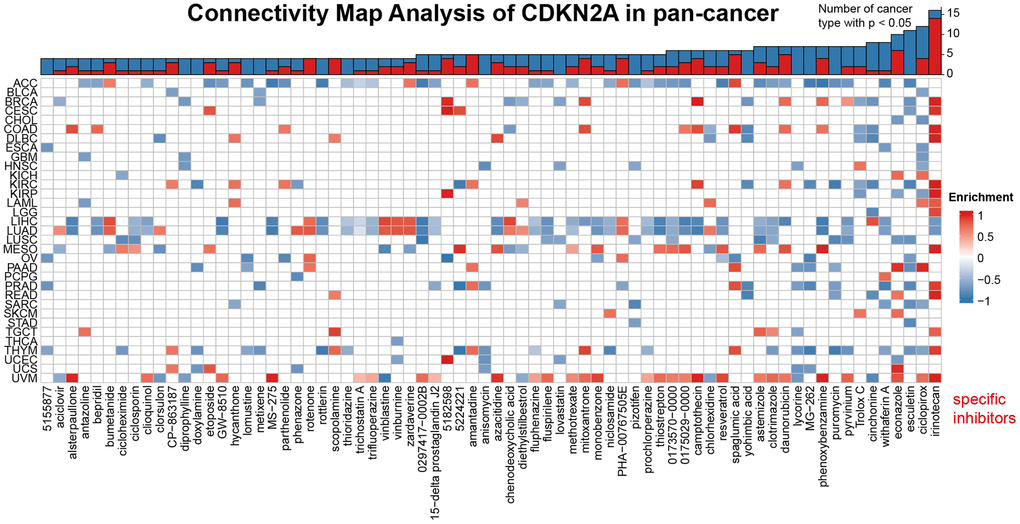
Figure 6.Heat map represents the enrichment score (blue positive, red negative) for each drug in the CMap database for each cancer. The components or drugs were sequentially decreased from right to left in the number of enriched cancers.
Figure 6 — The cell senescence regulator p16 is a promising cancer prognostic and immune check-point inhibitor (ICI) therapy biomarker | Aging