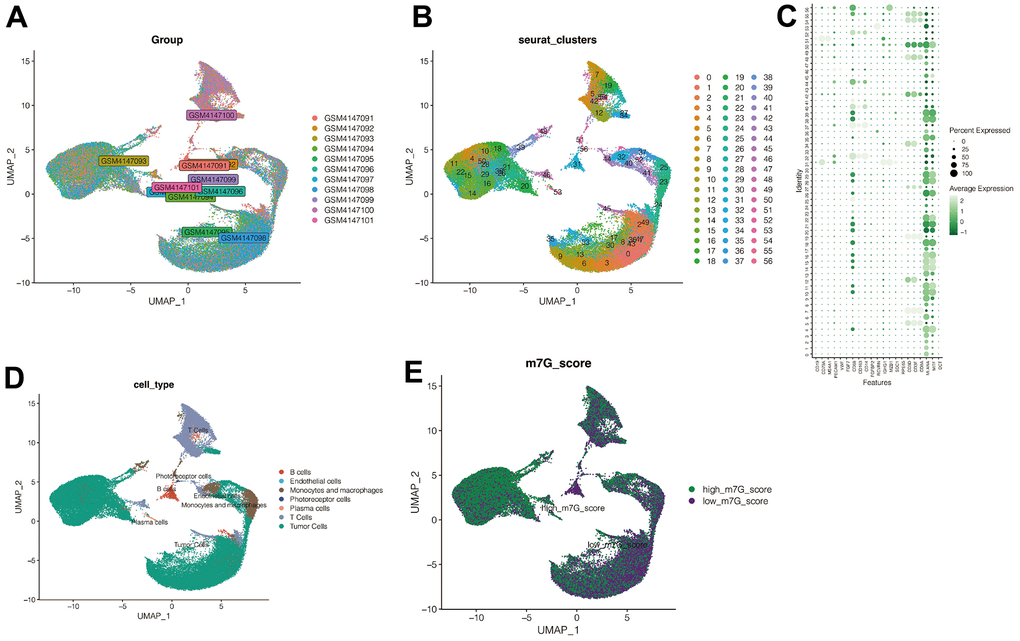
Figure 2.Single cell sequencing analysis. (A) No significant batch effects were found in the 11 samples in the single-cell dataset. (B) All cells were divided into 67 subclusters. (C, D) Cell annotation. (E) M7G scoring annotation. The cells were divided into high-M7G group and low-M7G group.