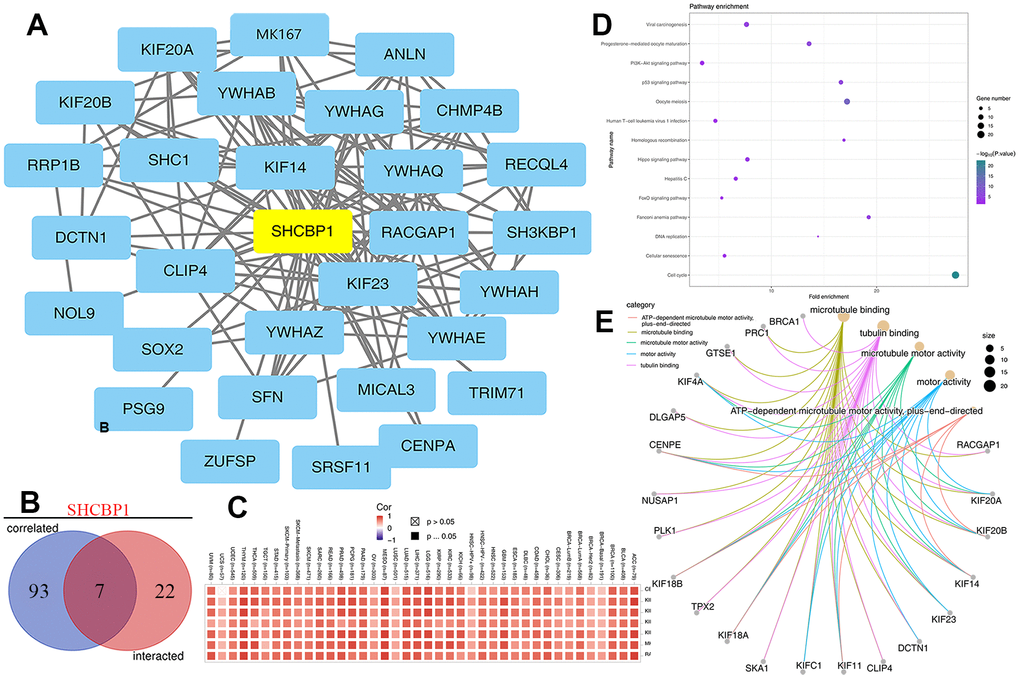
Figure 8.Analysis of SHCBP1 potential cellular functions. (A) The interaction network of first 50 SHCBP1-binding proteins in STING database. (B) The Venn diagram identified 7 genes (CENPA, MKI67, RACGAP1, KIF20A, KIF20B, KIF14, KIF23) based on SHCBP1-binding and related genes. (C) Heatmap analysis of the expression of 7 genes in pan-cancer. (D) Analysis of pathway enrichment. (E) The molecular function of GO analysis was investigated by Cnetplot.