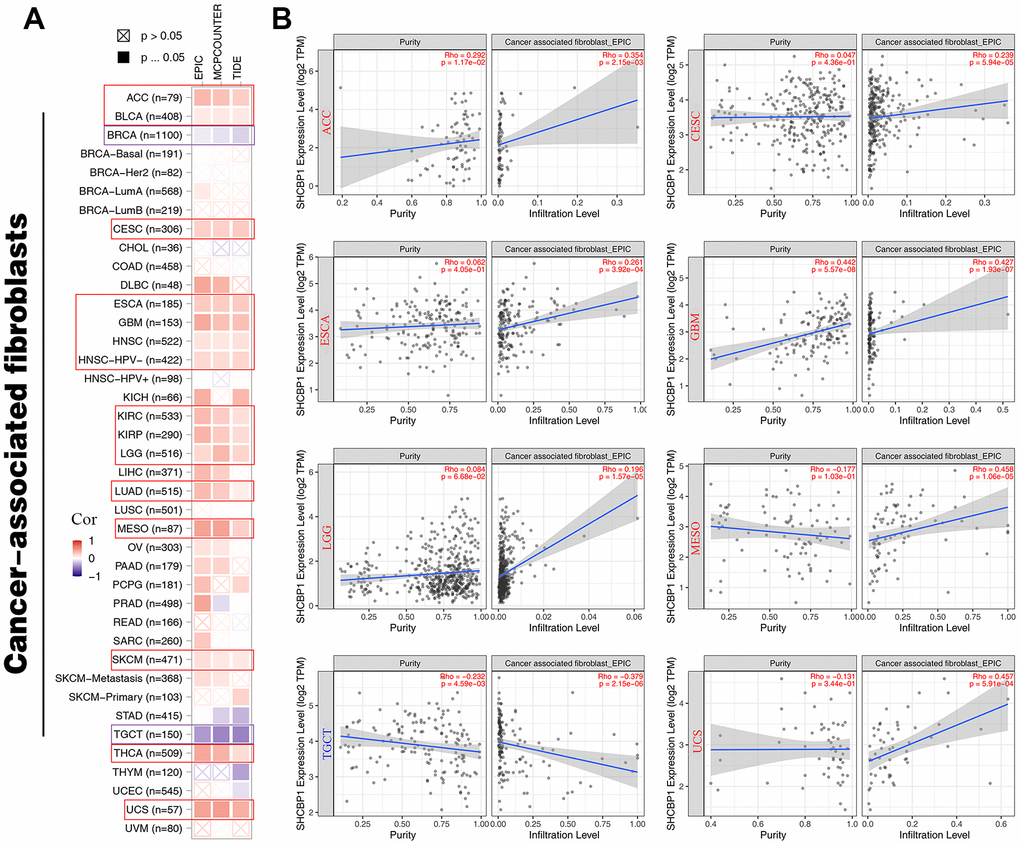
Figure 7.The relationship between SHCBP1 expression and cancer-associated fibroblasts in pan-cancer. (A) The EPIC, MCPCUNTER, and TIDE algorithms was conducted to investigate cancer-associated fibroblasts by heatmap. (B) The purity and infiltration level were presented in scatter plots on ACC, CESC, ESCA, GBM, LGG, MESO, TGCT and UCS.