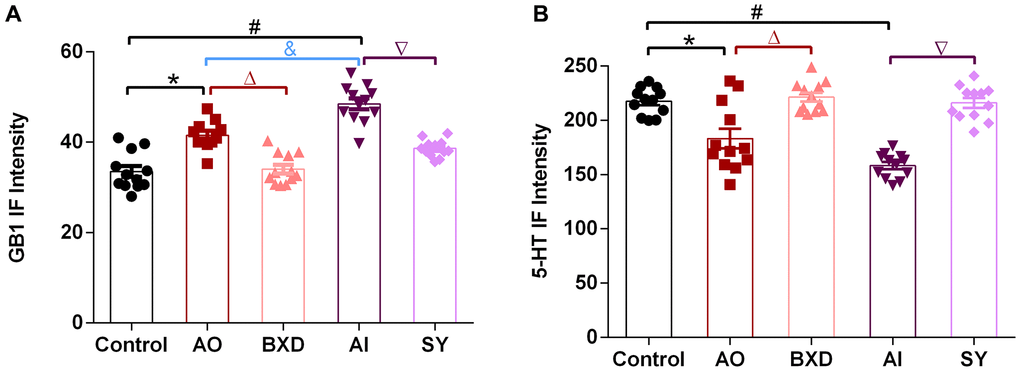
Figure 6.IF intensity of GB1 and 5-HT in the DRN. (A) GB1 intensity value, (B) 5-HT intensity value. Data are expressed as means ± SEM, *Anger-out group compared to the control group, #Anger-in group compared to the control group, &Anger-out group compared to Anger-in group, ΔAnger-out group compared to the BXD group, ∇Anger-in group compared to the SY group; P < 0.05, n = 12.