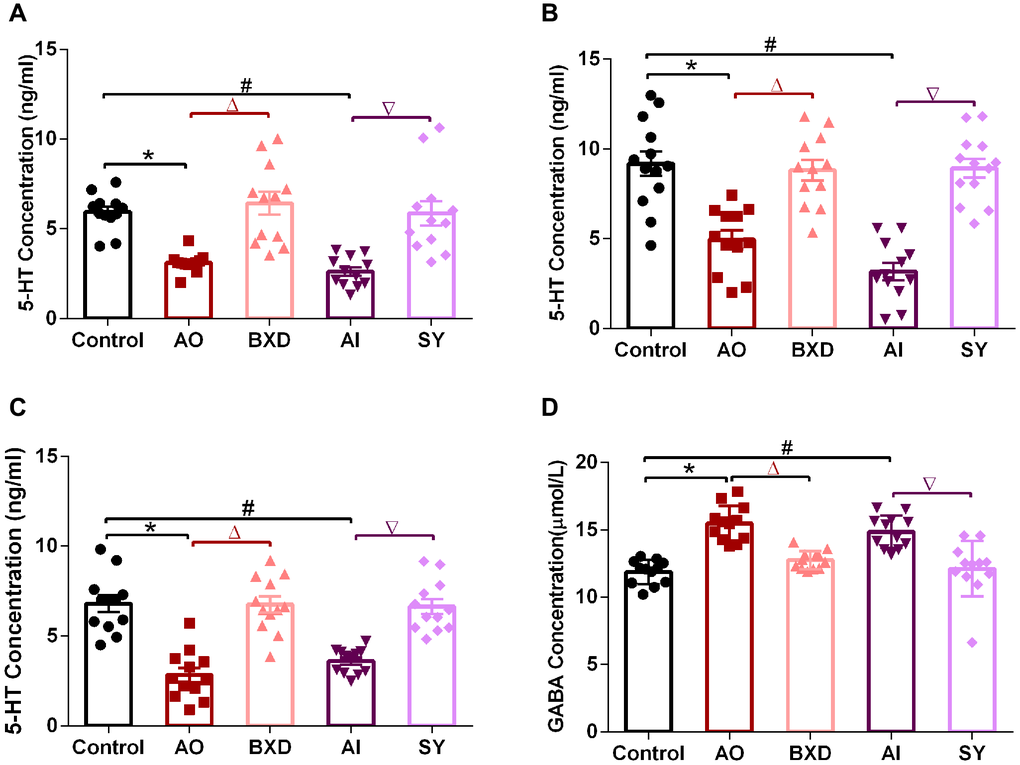
Figure 4.5-HT concentration in the PFC, hippocampus and hypothalamus, and GABA concentration in DRN after 7 days of treatment. (A) 5-HT concentration in the PFC, (B) 5-HT concentration in the hippocampus, (C) 5-HT concentration in hypothalamus, (D) GABA concentration in DRN; Data are expressed as means ± SEM, *Anger-out group compared to the control group, #Anger-in group compared to the control group, &Anger-out group compared to Anger-in group, ΔAnger-out group compared to the BXD group, ∇Anger-in group compared to the SY group; P < 0.05, n = 12.