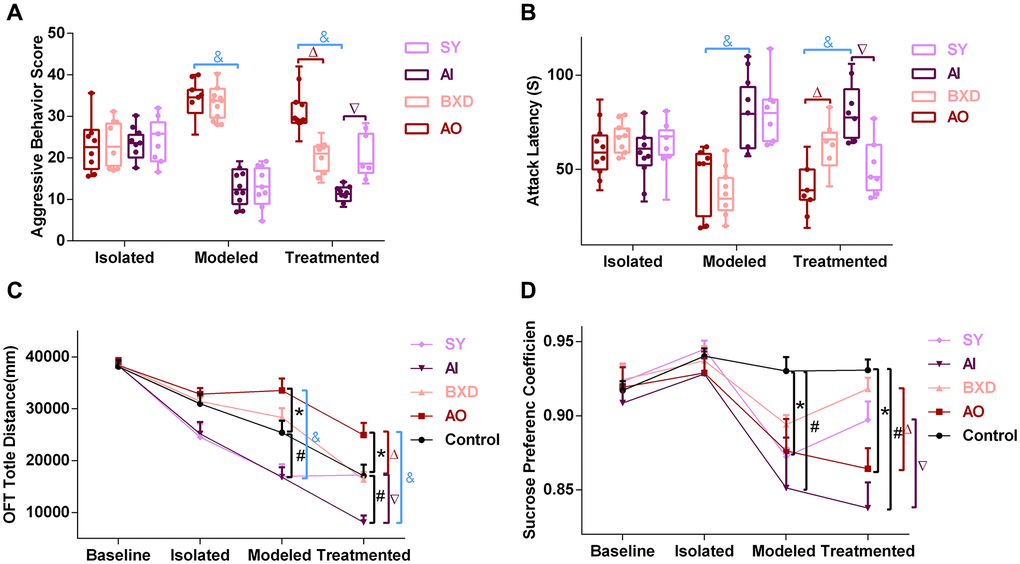
Figure 2.Behavior tests. (A) Aggressive behavior score, (B) Attack latency, (C) OFT total distance, (D) Sucrose preference coefficient; Data are expressed as means ± SEM, *Anger-out group compared to the control group, #Anger-in group compared to the control group, &Anger-out group compared to Anger-in group, ΔAnger-out group compared to the BXD group, ∇Anger-in group compared to the SY group; P < 0.05, n = 12.