Submit an Article
Navigate
Home
Editorial Board
Editorial Policies
Current Volume
Archive
Scientific Integrity
Publication Ethics Statements
Interviews with Outstanding Authors
Newsroom
Sponsored Conferences
Podcast
Contact
Special Collections
Submit an Article
Online ISSN: 1945-4589
Research Paper
|
Volume 15, Issue 6
|
pp. 2005–2032
Association between the sarcopenia index and the risk of stroke in elderly patients with hypertension: a cohort study
Back to article
Figure 1
(1 of 4)
−
100%
+
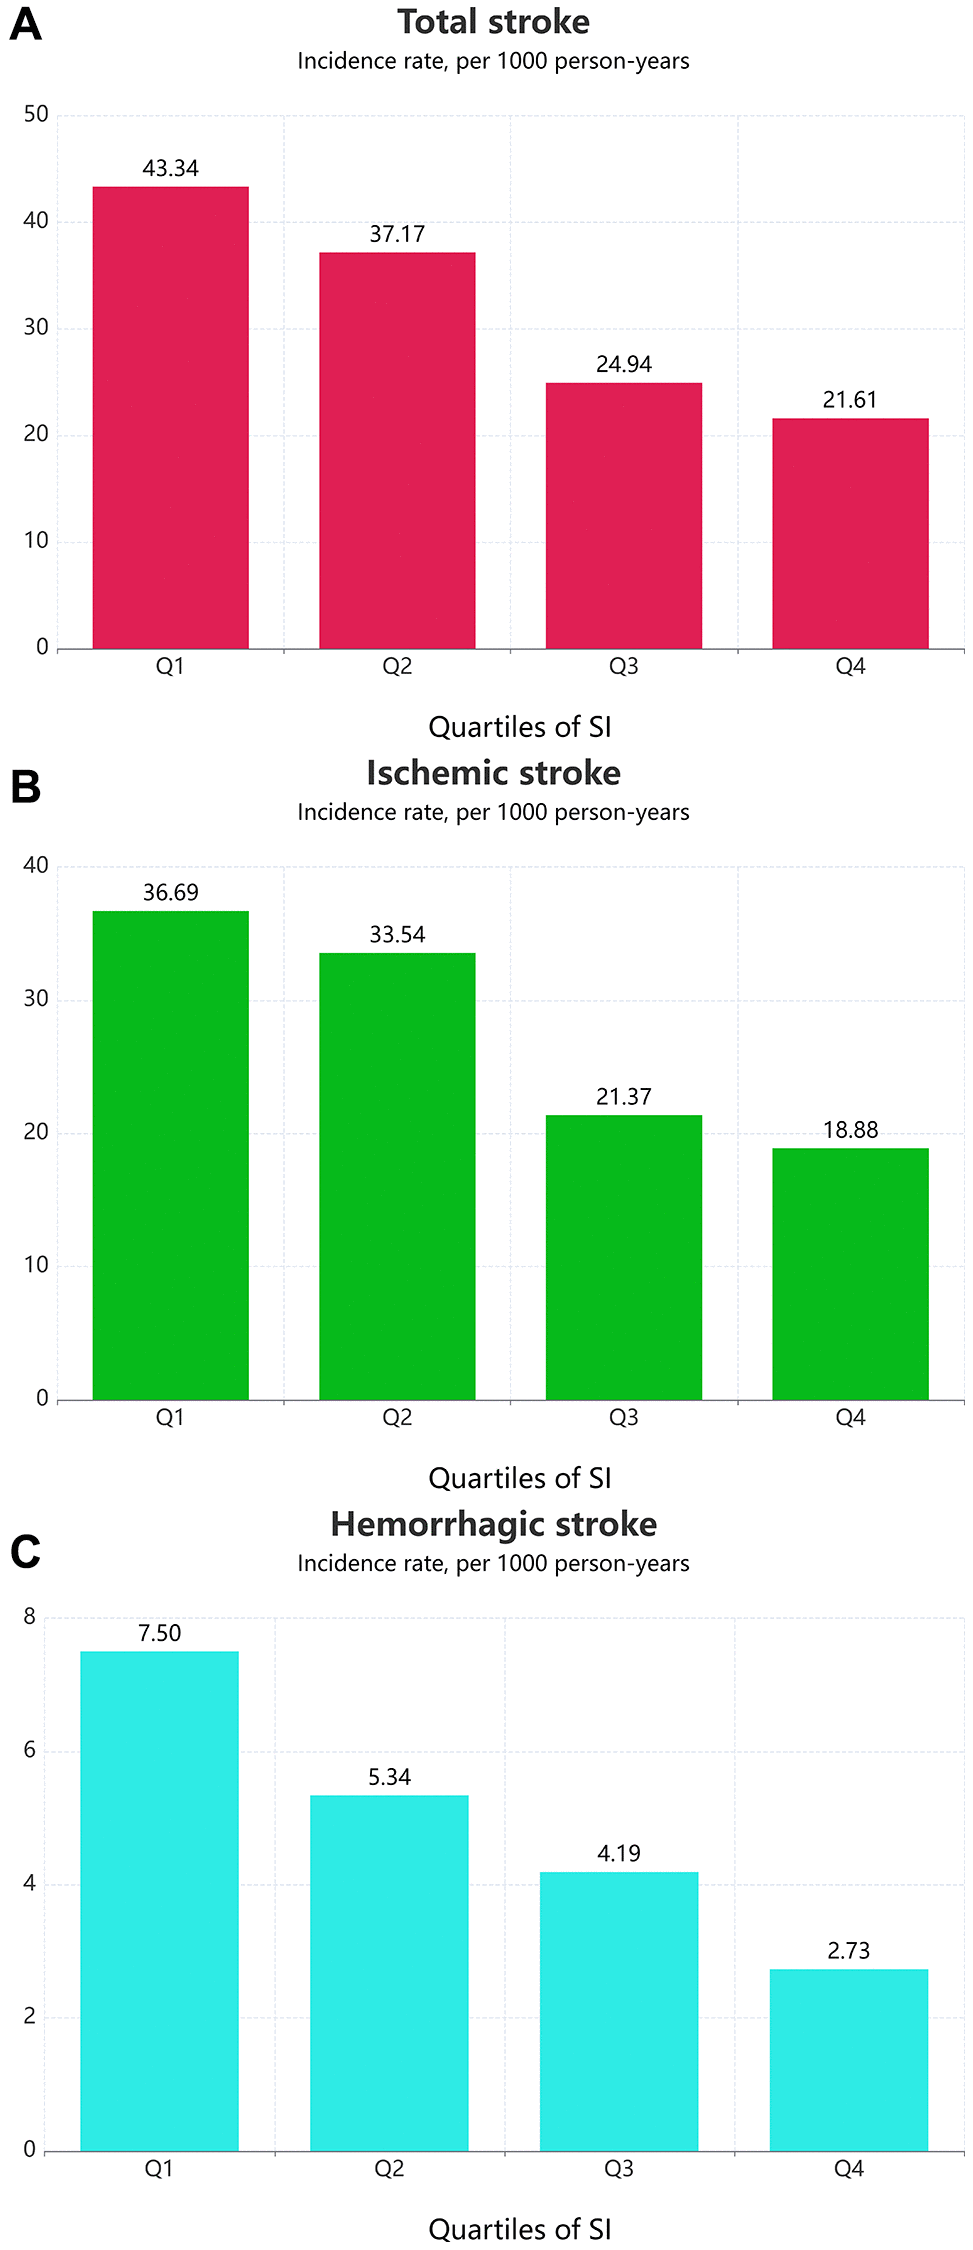
Figure 1.
Age-adjusted incidence of outcomes according to the SI quartiles.
(
A
) Total stroke; (
B
) Ischemic stroke; (
C
) Hemorrhagic stroke.