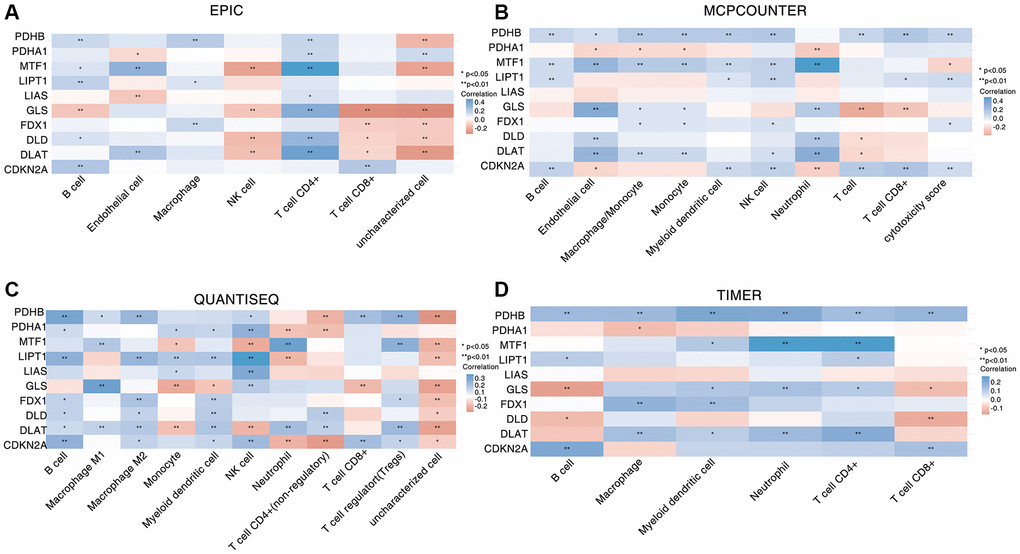
Figure 5.Correlation between CAGs expression and various immune cells infiltration of HNSC. (A–D) Four algorithms including EPIC (A), MCP-counter (B), quanTIseq (C) and TIMER (D) to evaluate the correlation between CAGs and immune cell infiltration. The ordinate represents CAGs, the abscissa represents different immune cells. *stands for significance levels, *for p < 0.05.