Submit an Article
Navigate
Home
Editorial Board
Editorial Policies
Current Volume
Archive
Scientific Integrity
Publication Ethics Statements
Interviews with Outstanding Authors
Newsroom
Sponsored Conferences
Podcast
Contact
Special Collections
Submit an Article
Online ISSN: 1945-4589
Research Paper
|
Volume 15, Issue 5
|
pp. 1524–1542
High expression of TARS is associated with poor prognosis of endometrial cancer
Back to article
Figure 11
(11 of 13)
−
100%
+
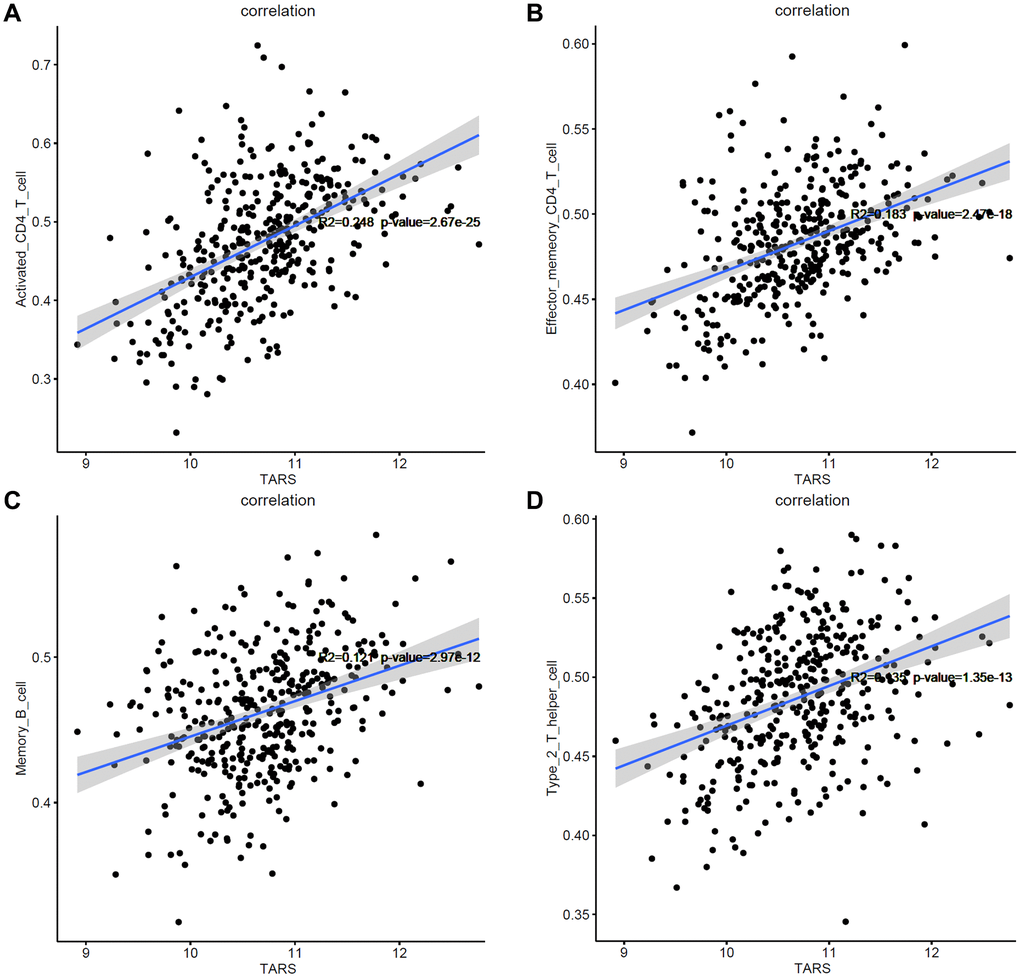
Figure 11.
Correlation between TARS expression and immune cells.
(
A
) Activated CD4
+
T cell. (
B
) Effector memory CD4
+
T cell. (
C
) Memory B cell. (
D
) Type 2 T helper cell.