Submit an Article
Navigate
Home
Editorial Board
Editorial Policies
Current Volume
Archive
Scientific Integrity
Publication Ethics Statements
Interviews with Outstanding Authors
Newsroom
Sponsored Conferences
Podcast
Contact
Special Collections
Submit an Article
Online ISSN: 1945-4589
Research Paper
|
Volume 15, Issue 4
|
pp. 1199–1209
Prognostic performance of serum YKL-40 for one-year clinical outcomes in acute ischemic stroke
Back to article
Figure 2
(2 of 4)
−
100%
+
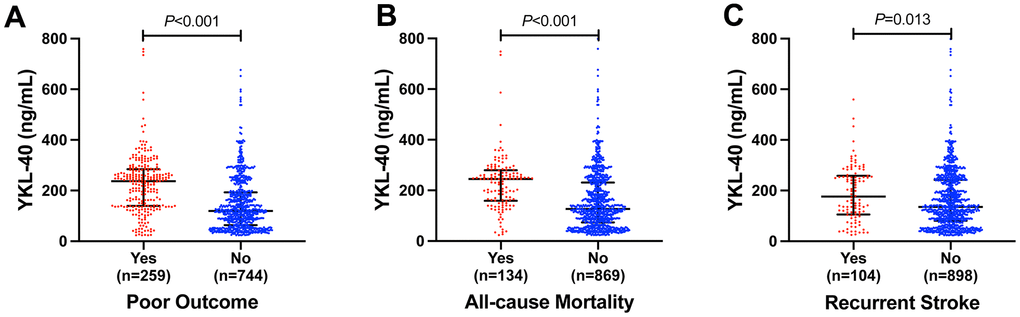
Figure 2.
Serum YKL-40 levels in different groups according to (
A
) poor outcome, (
B
) all-cause mortality and (
C
) recurrent stroke in AIS patients. Mann-Whitney U Test. Horizontal lines represent medians and interquartile ranges (IQRs).