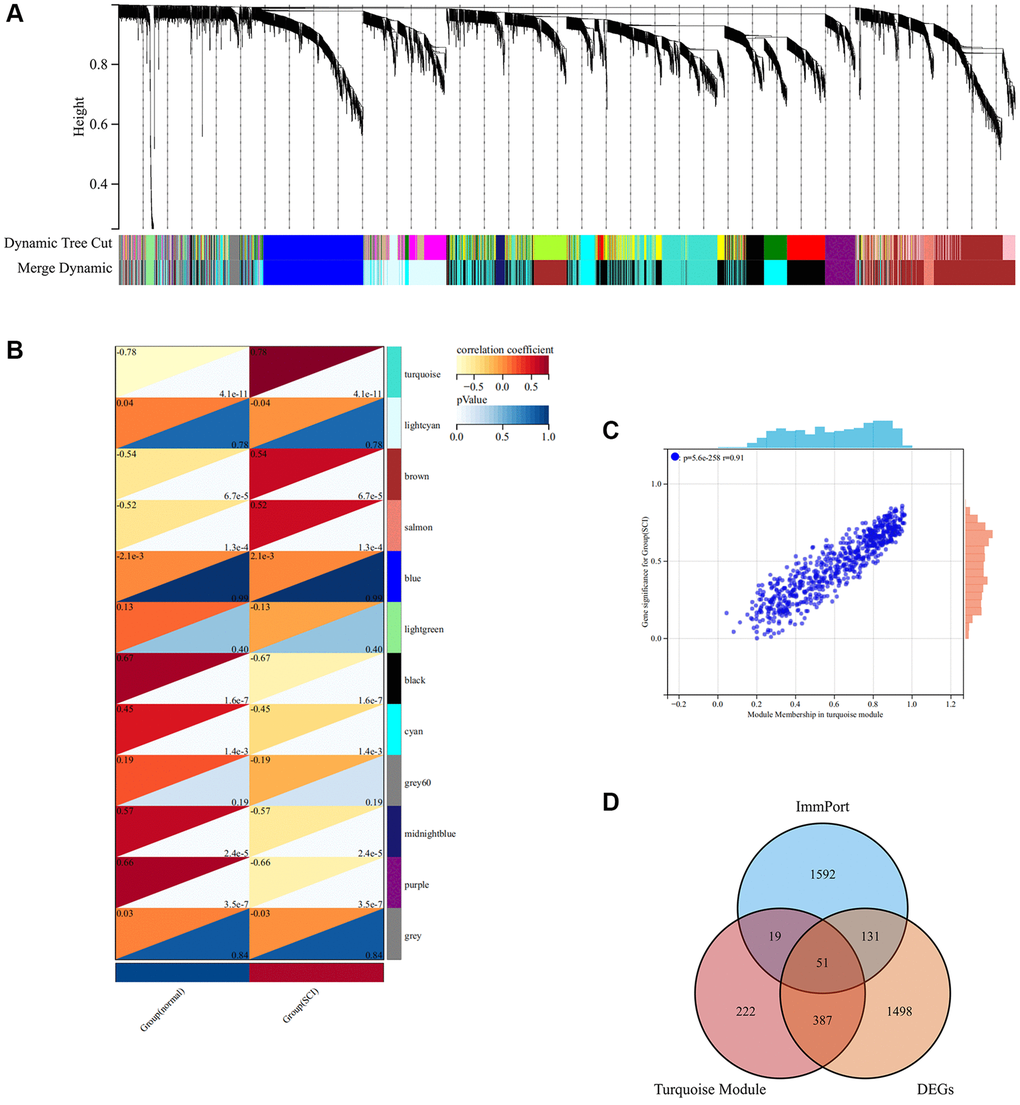
Figure 5.WGCNA analysis screening key module in SCI. (A) The cluster dendrogram of co-expression genes in SCI; (B) Co-relationship of different modules and characteristics; (C) Scatter plot showing the correlation between turquoise module and SCI; (D) Wayne analysis screening for important IRGs.