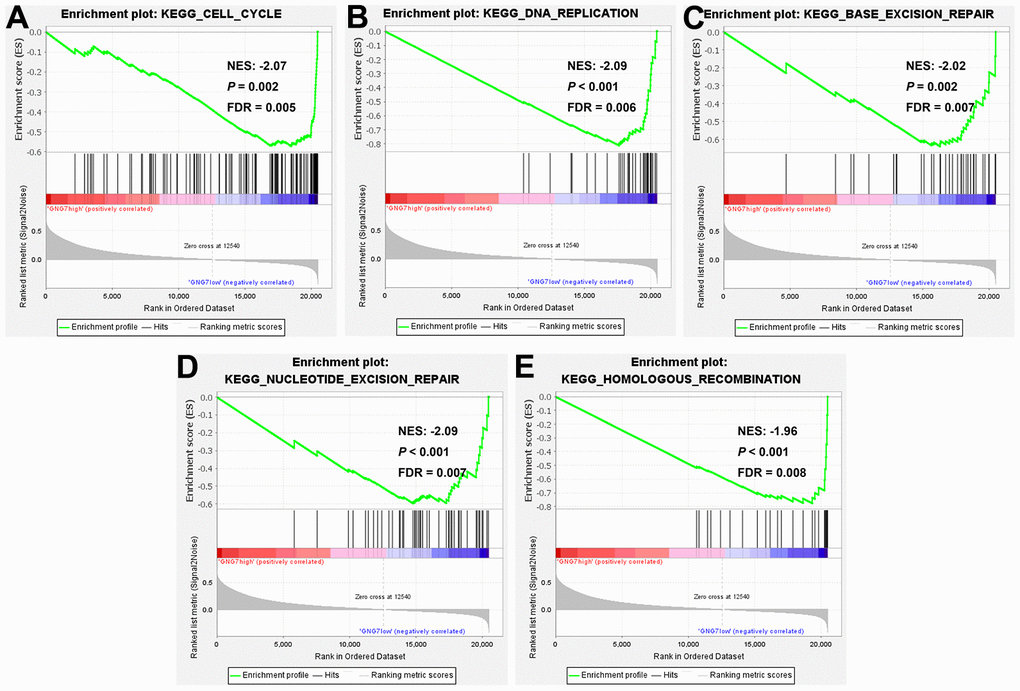
Figure 10.Gene set enrichment analysis (GSEA). KEGG pathway enrichment analysis of gene sets with lowly expressed GNG7 performed using TCGA-STAD data (A–E). FDR, false discovery rate; GSEA, gene set enrichment analysis; KEGG, Kyoto Encyclopedia of Genes and Genomes; NES, normalized enrichment score; and STAD, stomach adenocarcinoma.