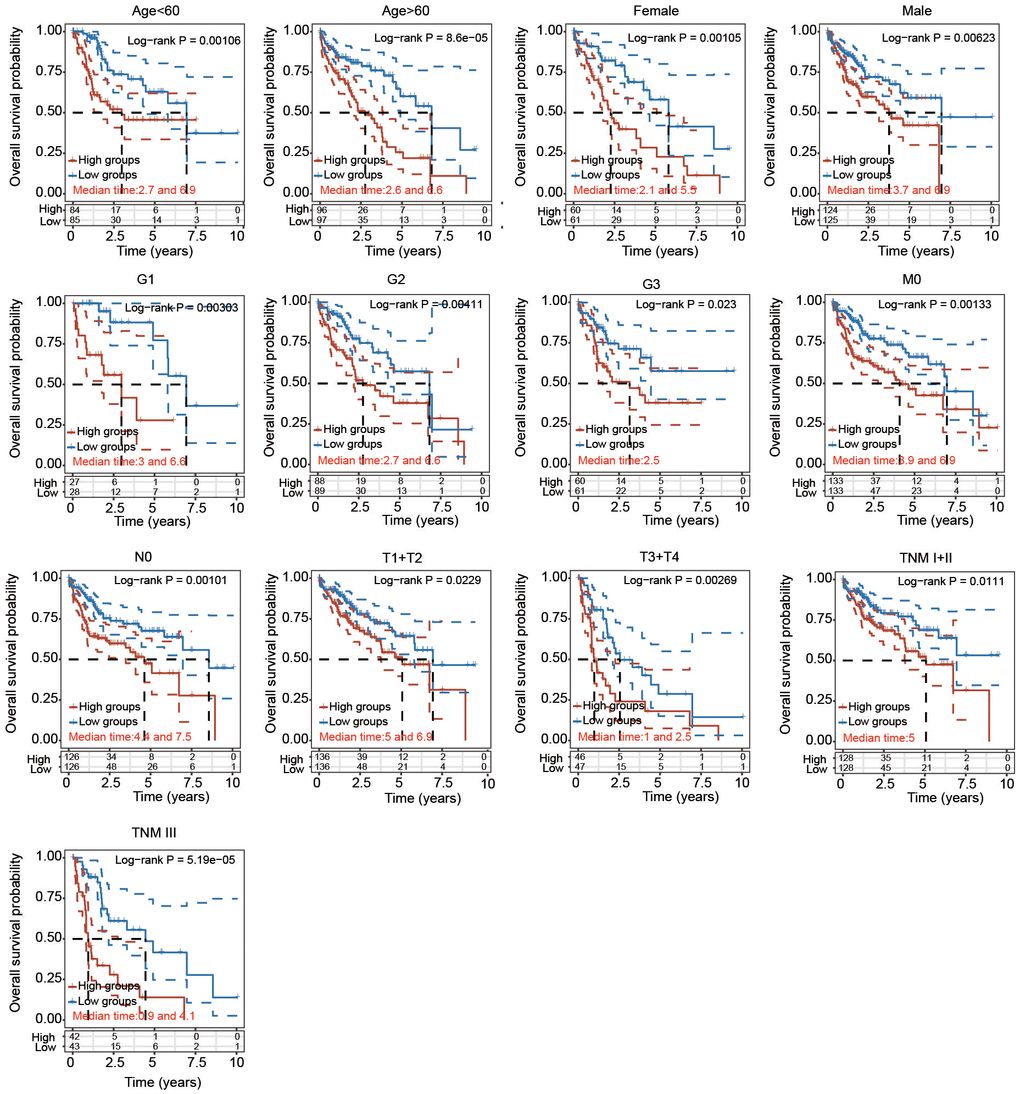
Figure 8.Prognostic potential of the risk score with different clinical parameters. KM analysis of OS between two subgroups stratified by age < 60, age > 60, male, female, T1 + T2, T3 + T4, G1, G2, G3, M0, N0, TNM I+II and TNM III with the log-rank test according to the TCGA database.