Submit an Article
Navigate
Home
Editorial Board
Editorial Policies
Current Volume
Archive
Scientific Integrity
Publication Ethics Statements
Interviews with Outstanding Authors
Newsroom
Sponsored Conferences
Podcast
Contact
Special Collections
Submit an Article
Online ISSN: 1945-4589
Research Paper
|
Volume 15, Issue 5
|
pp. 1394–1411
ACSL1, CH25H, GPCPD1, and PLA2G12A as the potential lipid-related diagnostic biomarkers of acute myocardial infarction
Back to article
Figure 3
(3 of 9)
−
100%
+
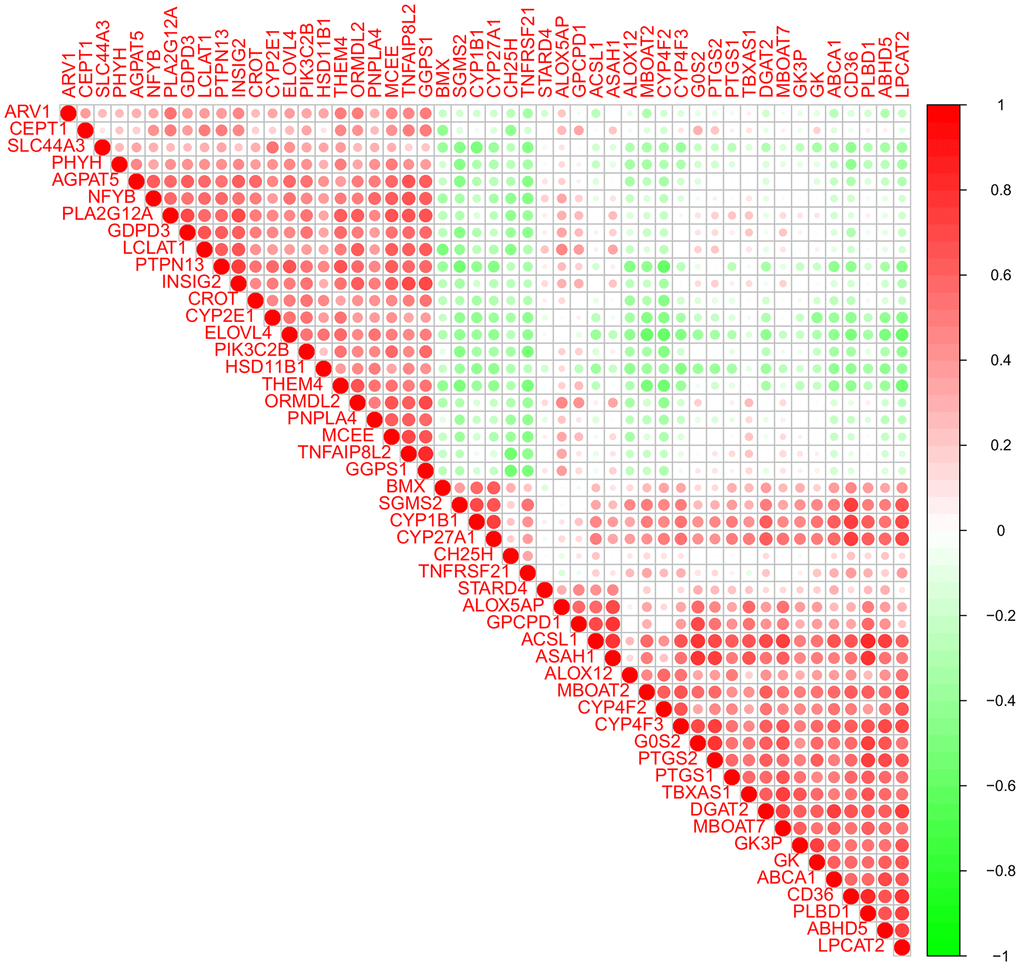
Figure 3.
Pearson correlation analysis of the 50 lipid-related differentially expressed genes (DEGs).