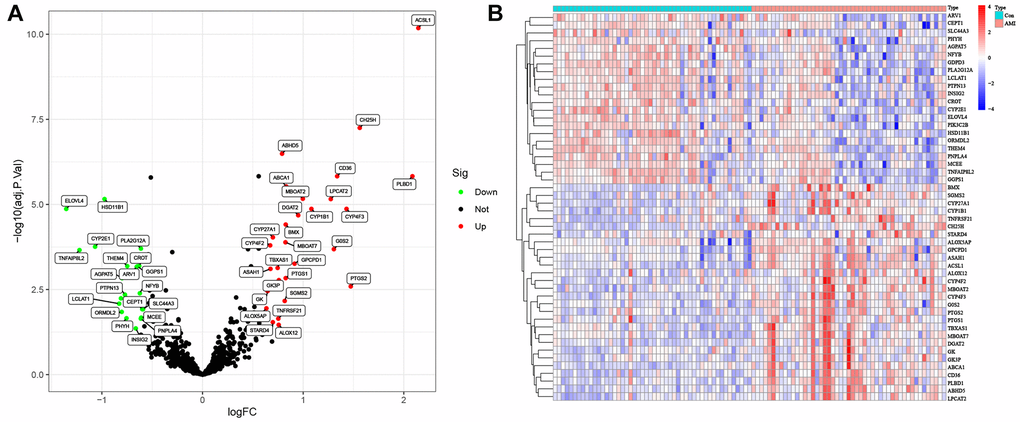
Figure 1.Lipid-related differentially expressed genes (DEGs) in AMI and healthy samples. (A) Volcano plot of the 673 lipid-related DEGs. Red dots represent significantly upregulated genes, and green significantly downregulated genes. (B) Heatmap of the 50 lipid-related DEGs in AMI and healthy samples.