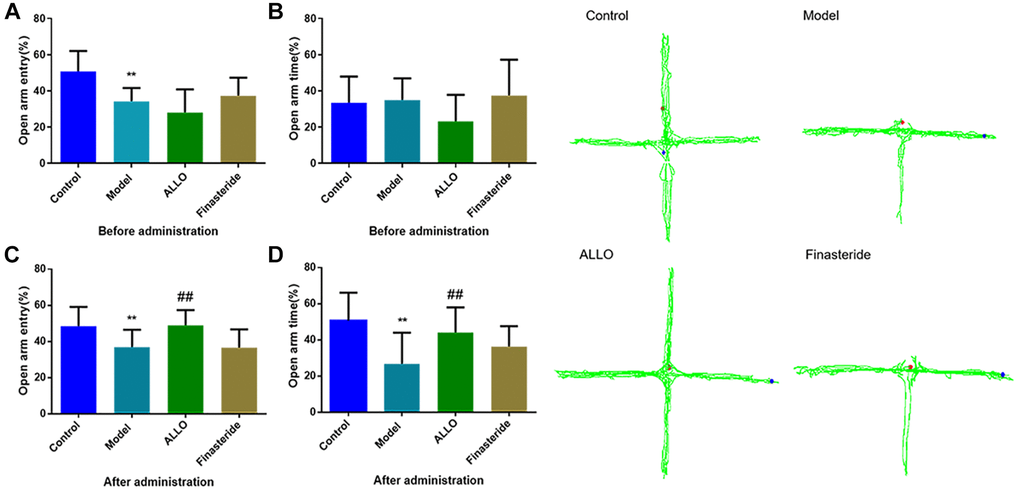
Figure 4.Effects of exogenous ALLO on EPM in PMDD-LIS rat models. (A) The OE% of rats before administration, (B) The OT% of rats before administration, (C) The OE% of rats after administration, (D) The OT% of rats before administration. Compared with the normal group: #p < 0.05, ##p < 0.01; compared with the model group, #p < 0.05, ##p < 0.01.