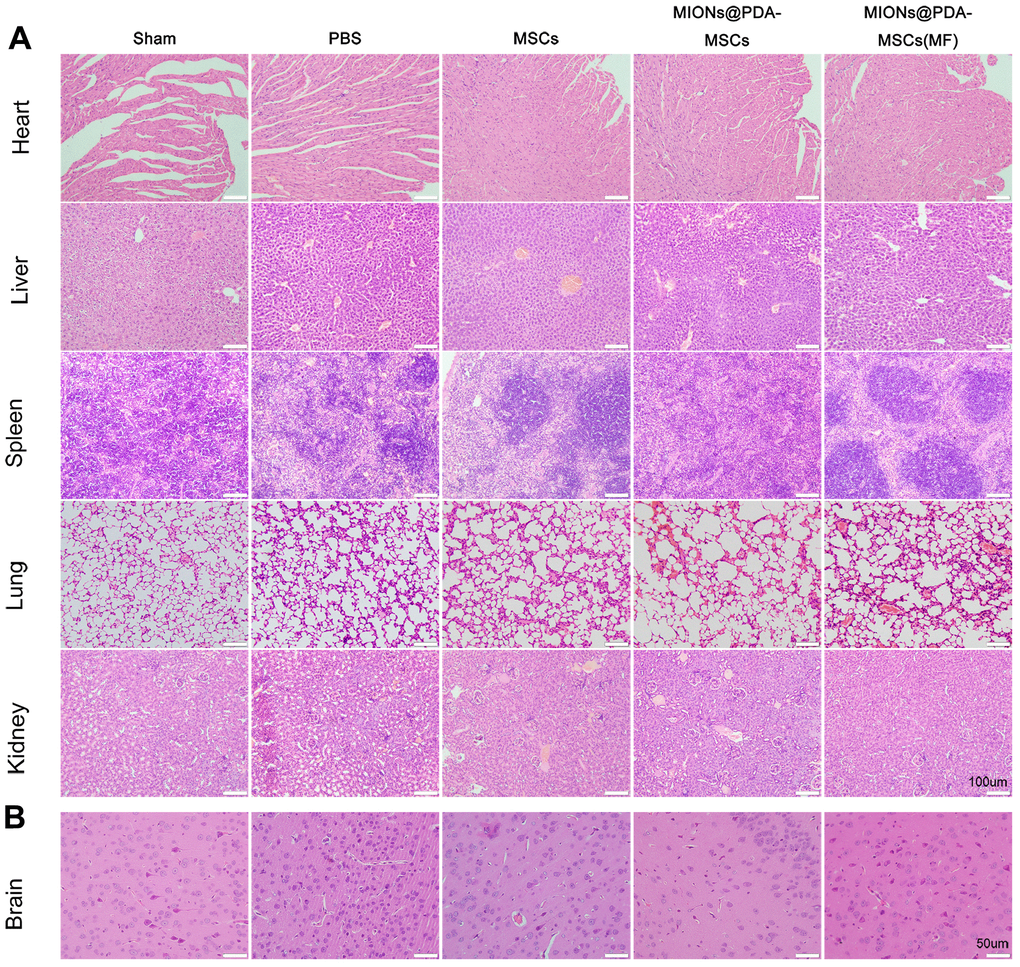
Figure 4.Histopathological changes observed in different organs of mice in each group. (A) The organs of each group were stained with hematoxylin and eosin. scale bars = 100 μm. (B) Pathological changes in cortical tissue. scale bars = 50 μm.
Figure 4 — Effects of magnetically targeted iron oxide@polydopamine-labeled human umbilical cord mesenchymal stem cells in cerebral infarction in mice | Aging