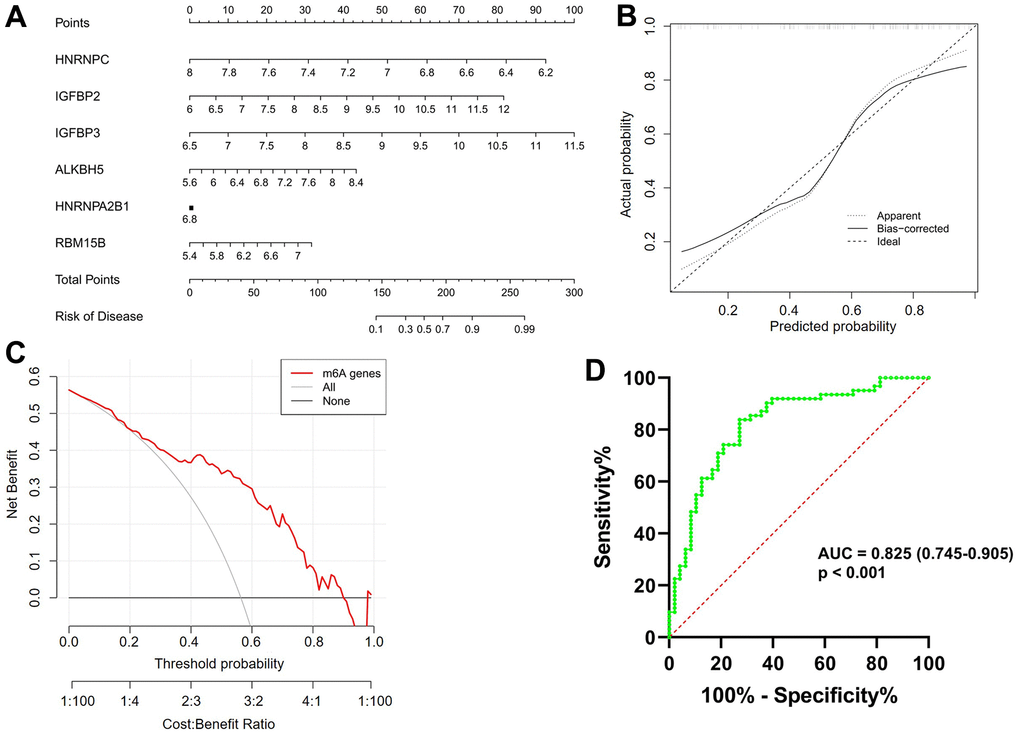
Figure 3.Construction and validation of a predictive nomogram of atrial fibrillation established based on six m6A regulators. (A) The nomogram of the model. (B) The calibration plot of the nomogram, and the diagonal dotted line represents a perfect prediction by an ideal model. (C) Decision curve analysis (DCA) of the nomogram. The solid line represents the performance of the nomogram, of which a closer fit to the diagonal dotted line represents a better prediction. (D) Receiver operating characteristic (ROC) analysis of the nomogram confirming that the model was effective in distinguishing atrial fibrillation patients from healthy subjects.