Submit an Article
Navigate
Home
Editorial Board
Editorial Policies
Current Volume
Archive
Scientific Integrity
Publication Ethics Statements
Interviews with Outstanding Authors
Newsroom
Sponsored Conferences
Podcast
Contact
Special Collections
Submit an Article
Online ISSN: 1945-4589
Research Paper
|
Volume 15, Issue 5
|
pp. 1371–1393
Identification of m6A regulator-mediated RNA methylation modification patterns and key immune-related genes involved in atrial fibrillation
Back to article
Figure 10
(10 of 10)
−
100%
+
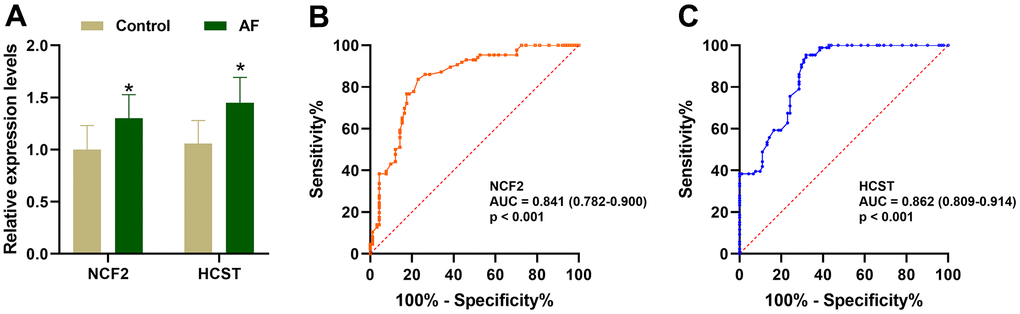
Figure 10.
Validation of the
NCF2
and
HCST
genes in clinical samples.
(
A
) The relative expression levels of
NCF2
and
HCST
in clinical samples. (
B
) ROC curve analysis of
NCF2
. (
C
) ROC curve analysis of
HCST
. *
P
< 0.05; **
P
< 0.01; ***
P
< 0.001.