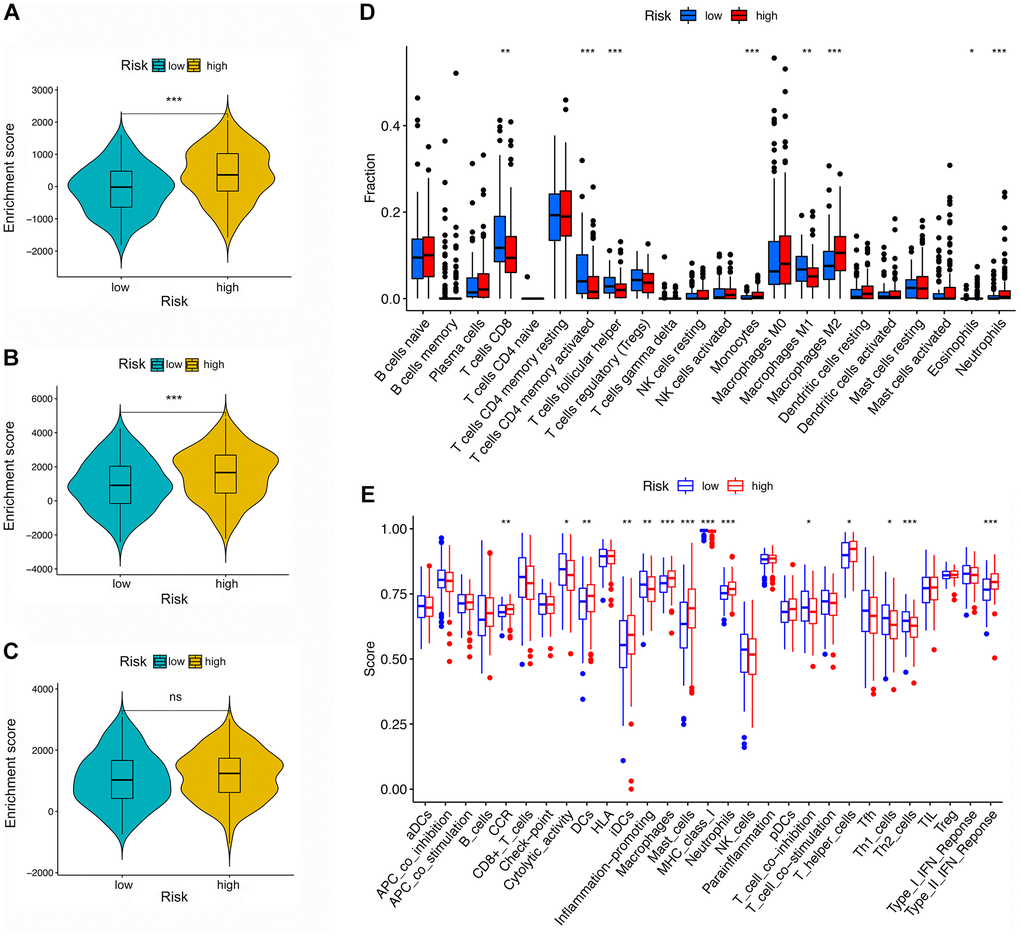
Figure 6.TME and immune cell infiltration in different risk groups. (A–C) TME analysis based on ESTIMATE algorithm. From top to bottom: The stromal score, ESTIMATE score, and immune score. (D) Immune cell infiltration in high- and low-risk groups based on the CIBERSORT algorithm. (E) Immune-related pathways based on ssGSEA.