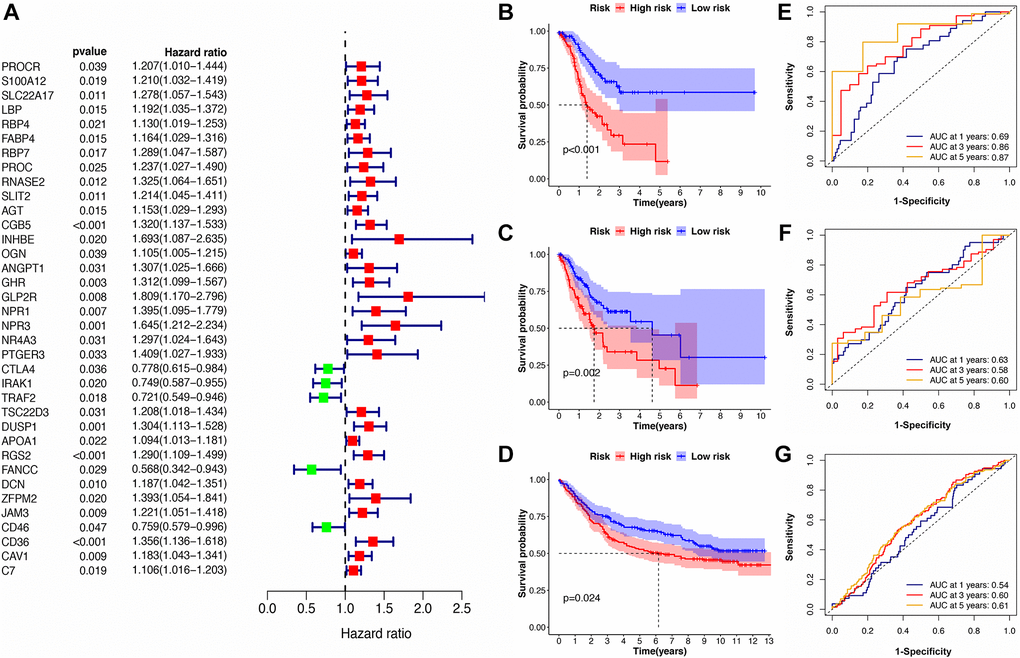
Figure 3.Identification of the immune-related prognostic signature. (A) The forest plot of univariate Cox regression analysis for IRGs. (B–D) The Kaplan-Meier survival curves for high- and low-risk groups in train, test, and validation cohorts. (E–G) The ROC curve for the IRS in train, test, and validation cohorts.