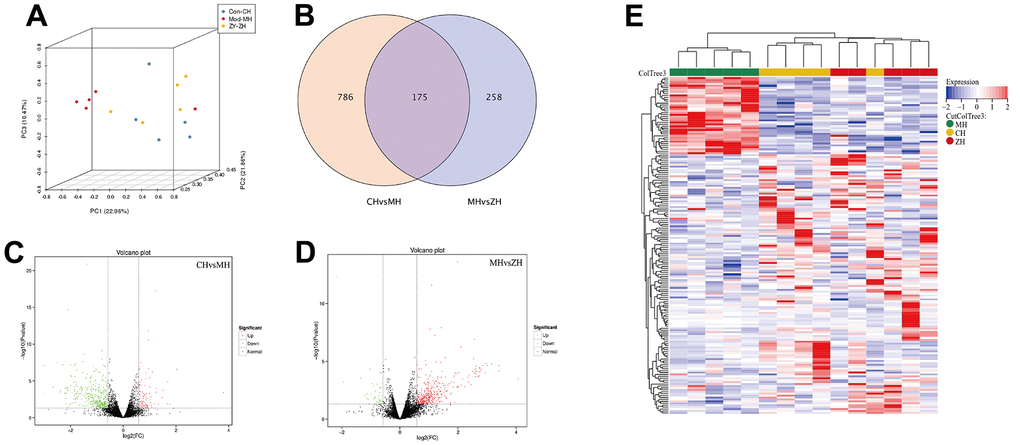
Figure 4.The differentially expressed mRNA analysis of control group, model group and YHY decoction group (n=5). (A) PCA diagram showing that samples distribution among different groups; (B) Venn diagram showing the DEGs of three groups; (C, D) Volcano plot of DEGs, screening parameters were P-value<0.05 and absolute value of log2 (Fold Change) ≥1.5; (E) Heatmaps of 175 DEGs intersected by three groups.