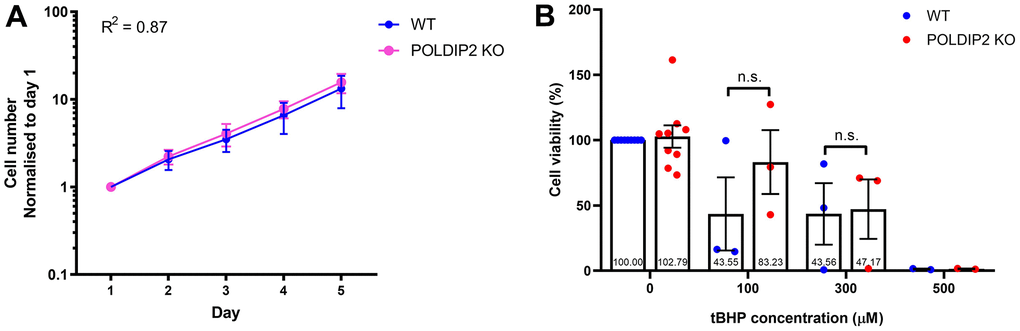
Figure 3.Knockout of POLDIP2 in ARPE-19 shows normal levels of cell proliferation and viability. (A) Cell proliferation of WT and POLDIP2 KO cell lines. Normalised cell numbers expressed as mean ± SEM, n=3. (B) Cell viability analysis of WT and POLDIP2 KO cell lines in the presence or absence of tBHP. Results are presented as mean ± SEM of 2-9 biological repeats, each with 8 technical repeats.