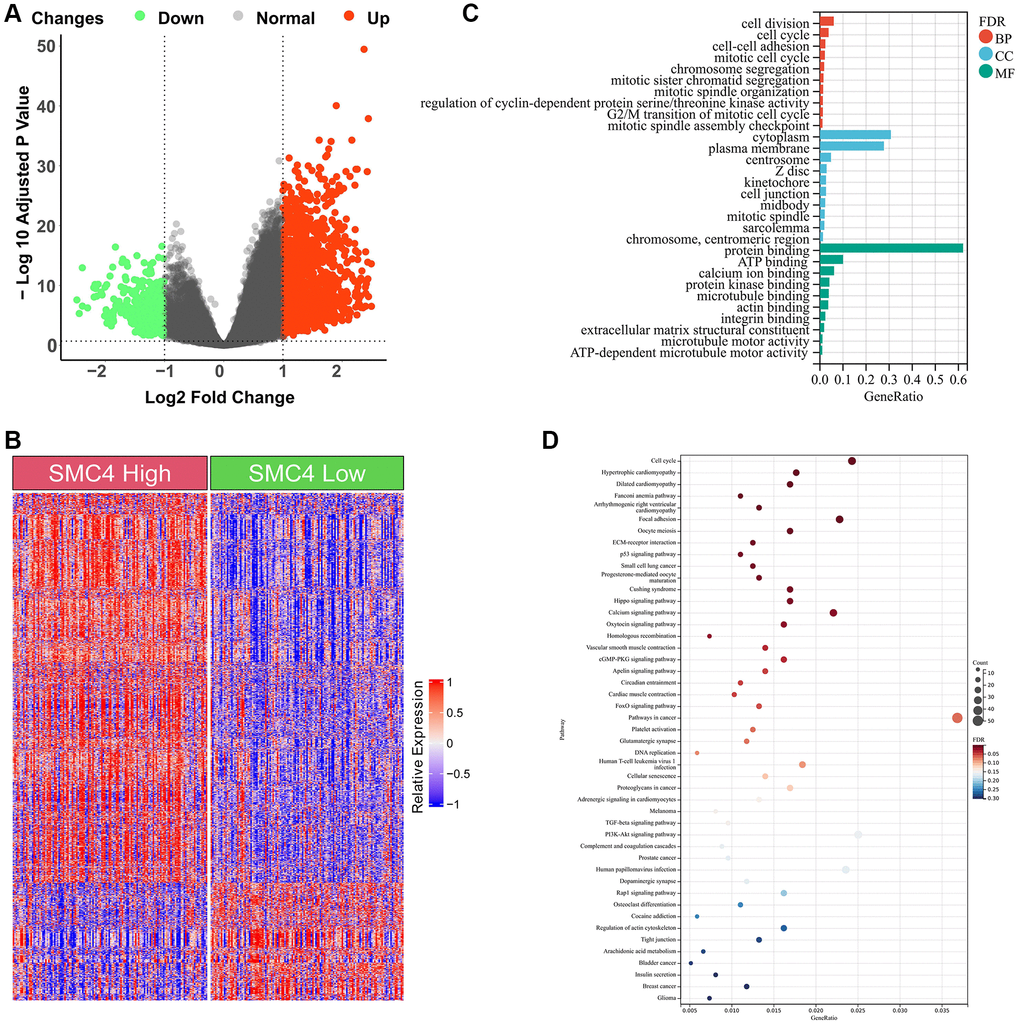
Figure 5.Enrichment analysis of DEGs between SMC4 high group and SMC4 low group. (A) Volcano plot of DEGs; (B) Heatmap of DEGs; (C) GO analysis; (D) KEGG analysis.
Figure 5 — Association of SMC4 with prognosis and immune infiltration of sarcoma | Aging