Submit an Article
Navigate
Home
Editorial Board
Editorial Policies
Current Volume
Archive
Scientific Integrity
Publication Ethics Statements
Interviews with Outstanding Authors
Newsroom
Sponsored Conferences
Podcast
Contact
Special Collections
Submit an Article
Online ISSN: 1945-4589
Research Paper
|
Volume 15, Issue 2
|
pp. 513–523
Epigenetic age acceleration correlates with BMI in young adults
Back to article
Figure 2
(2 of 3)
−
100%
+
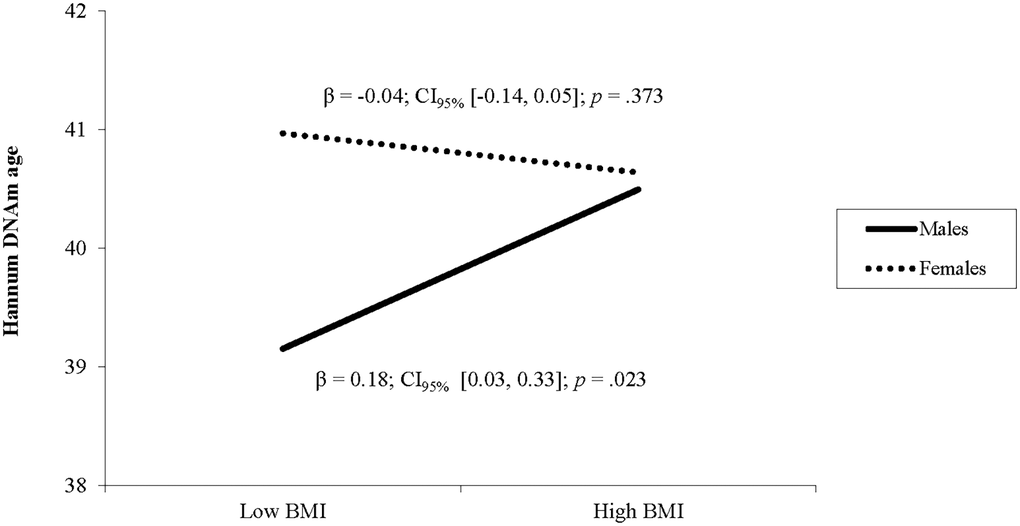
Figure 2.
The relationship between BMI and Hannum DNAm varies by sex.
Note: Low and high BMI were defined as 1 SD below and above the mean.