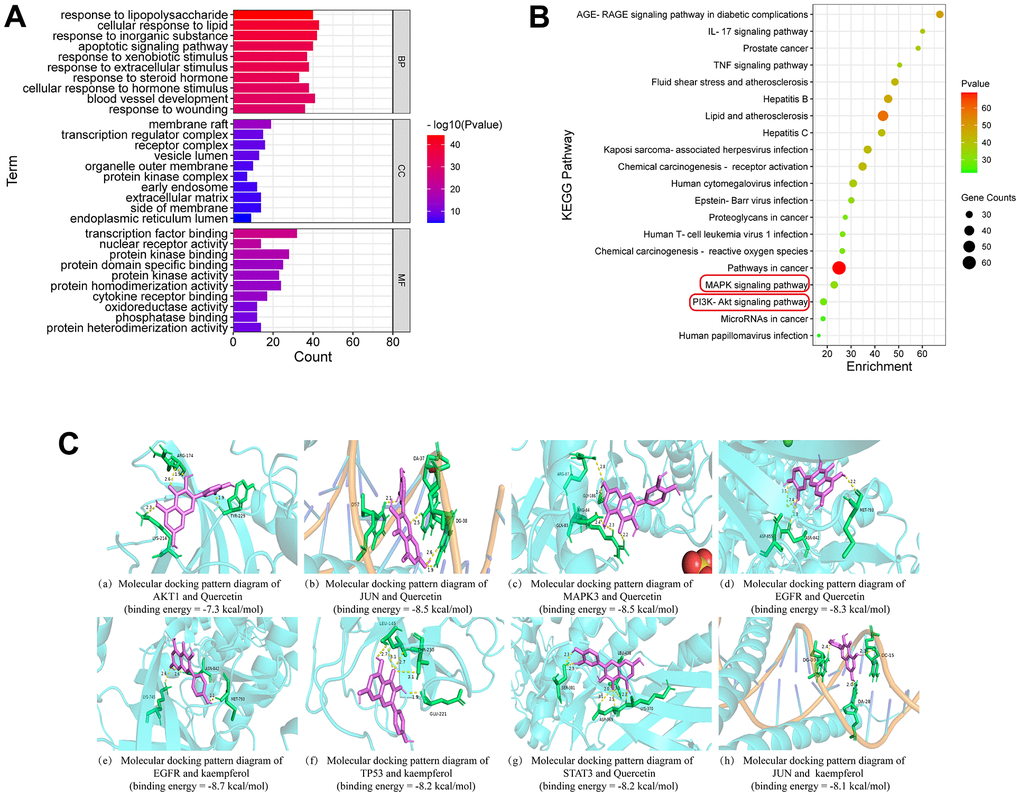
Figure 3.Enrichment analysis and molecular docking. (A) GO enrichment analysis. (B) The bubble diagram of KEGG pathway enrichment analysis. An increase in the value of P is shown by a change in the color of the nodes from green to red, and an increase in the number of genes is indicated by a change in the size of the nodes from tiny to large. (C) Molecular docking patterns of active ingredients and core targets.