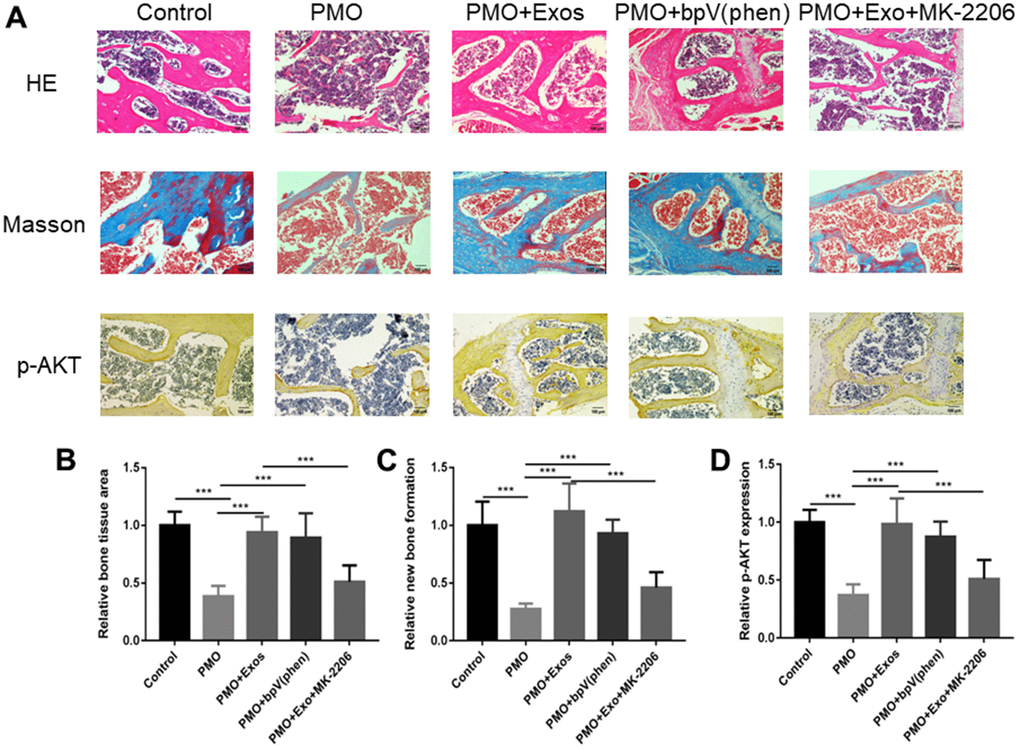
Figure 5.(A) HE staining, Masson staining and IHC (p-AKT) staining were performed to investigate osteogenesis between different groups. (B) The bone volume was calculated by HE staining using ImageJ. (C) The new bone formation rate was calculated by HE staining using ImageJ. (D) The expression of p-AKT was calculated by HE staining using ImageJ.