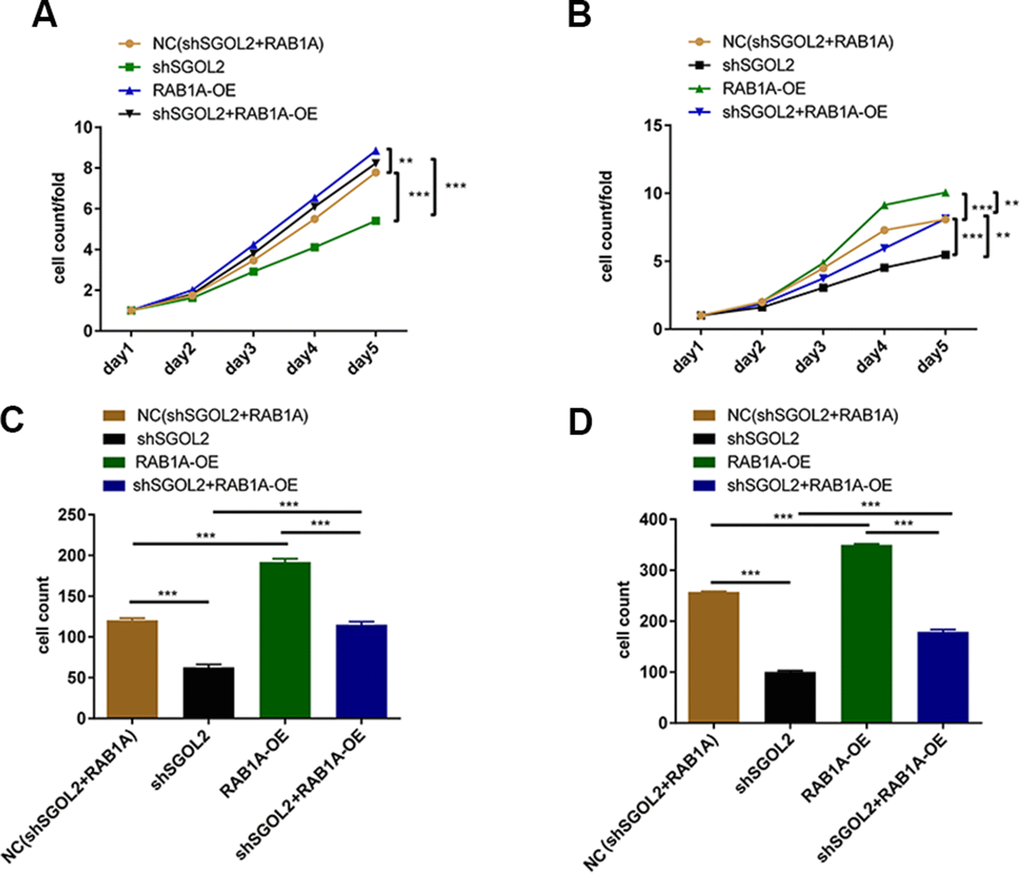
Figure 5.Control group, shSGOL2 + RAB1A-OE group, shSGOL2 group, RAB1A-OE group after transfecting with corresponding plasmids were subjected to the proliferation by Celigo cell counting assay in DU145 (A) and LNCaP (B), cell migration by transwell assay in DU145 (C) and LNCaP (D).