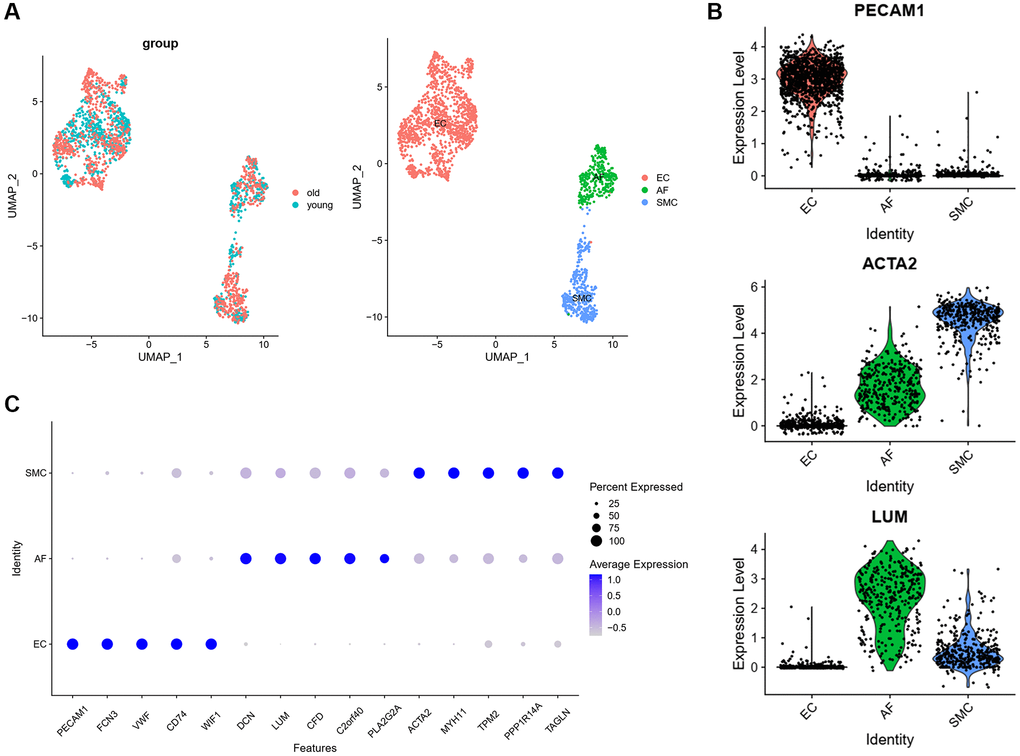
Figure 1.Transcriptomic profile of aortic arches from young and old monkeys. (A) UMAP plots of the scRNA-seq datasets displayed by group and cell type. (B) The expression of classic markers in each cell type. (C) Top 5 marker genes in each cell type. Abbreviation: UMAP: Uniform Manifold Approximation and Projection.