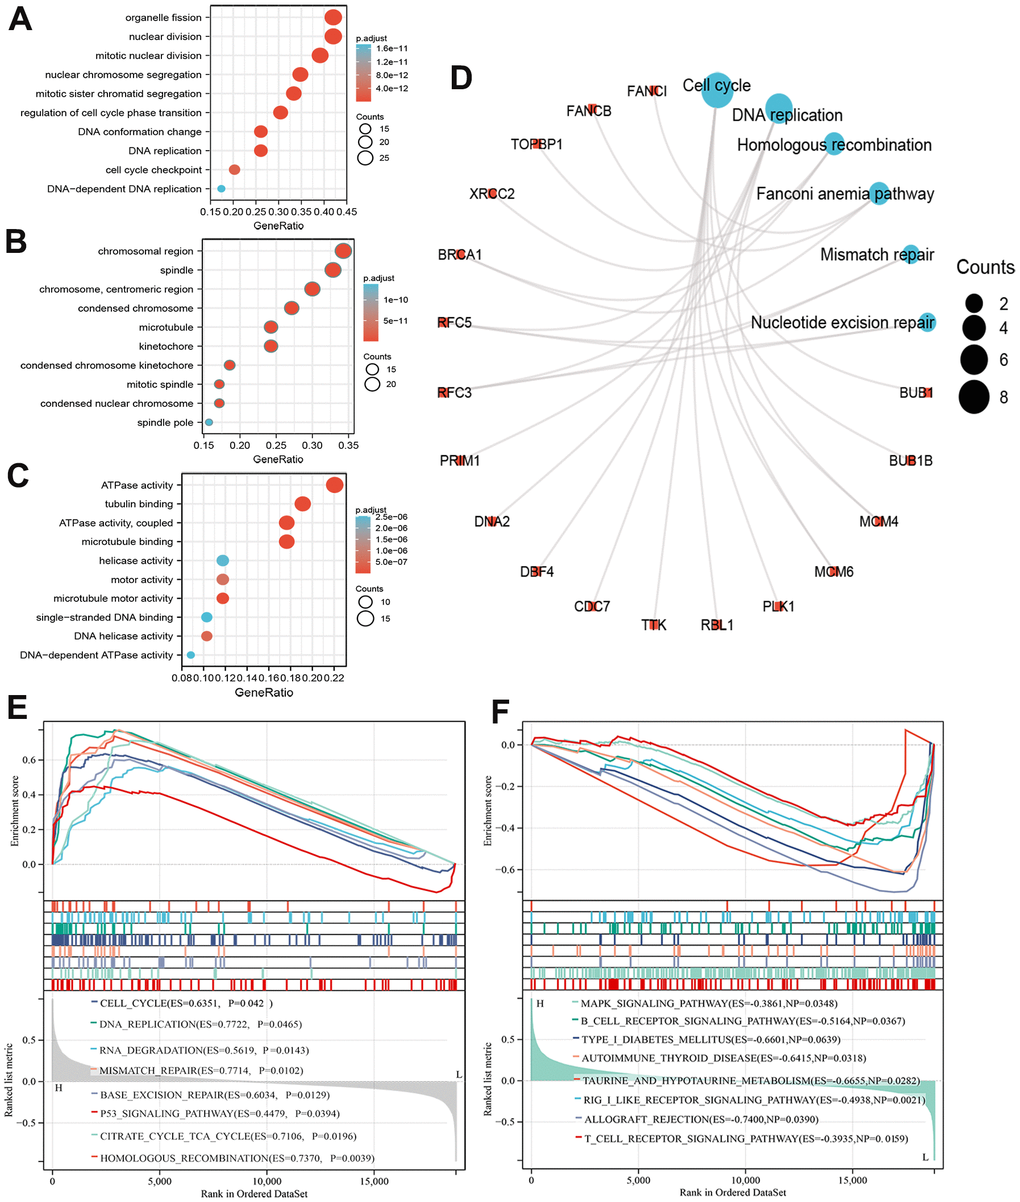
Figure 8.Functional enrichment analysis of MCM8 in HCC. (A–C) The bubble diagram for the biological process (A), cellular component (B), and molecular function (C) items in GO analysis on co-expression genes of MCM8. (D) Results of KEGG enrichment analysis on co-expression genes of MCM8. (E, F) GSEA results of significant signaling pathways that high (E) and low (F) MCM8 expression data sets enriched.