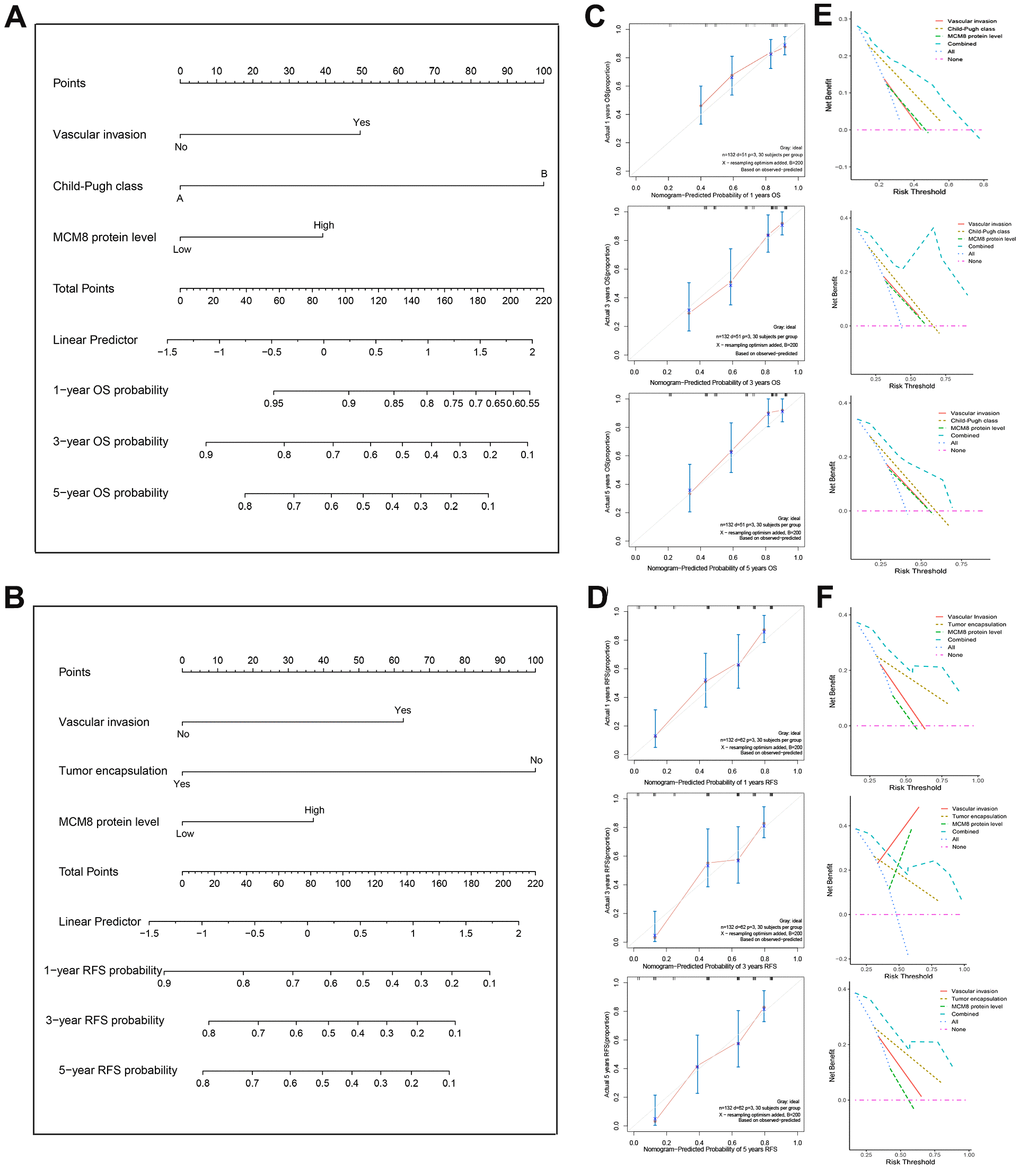
Figure 4.Construction and validation of the prognostic nomogram. (A, B) Nomogram established from a cohort of 132 HCC patients to predict OS (A) and RFS (B) probability. (C, D) The calibration plot of the nomogram for predicting the OS (C) and RFS (D) survival probability at 1-, 3-, and 5-year. (E, F) DCA curves shown that nomogram exhibited highest net benefit for 1-, 3-, and 5-year OS (E) and RFS (F) prediction than three single predictive factors.