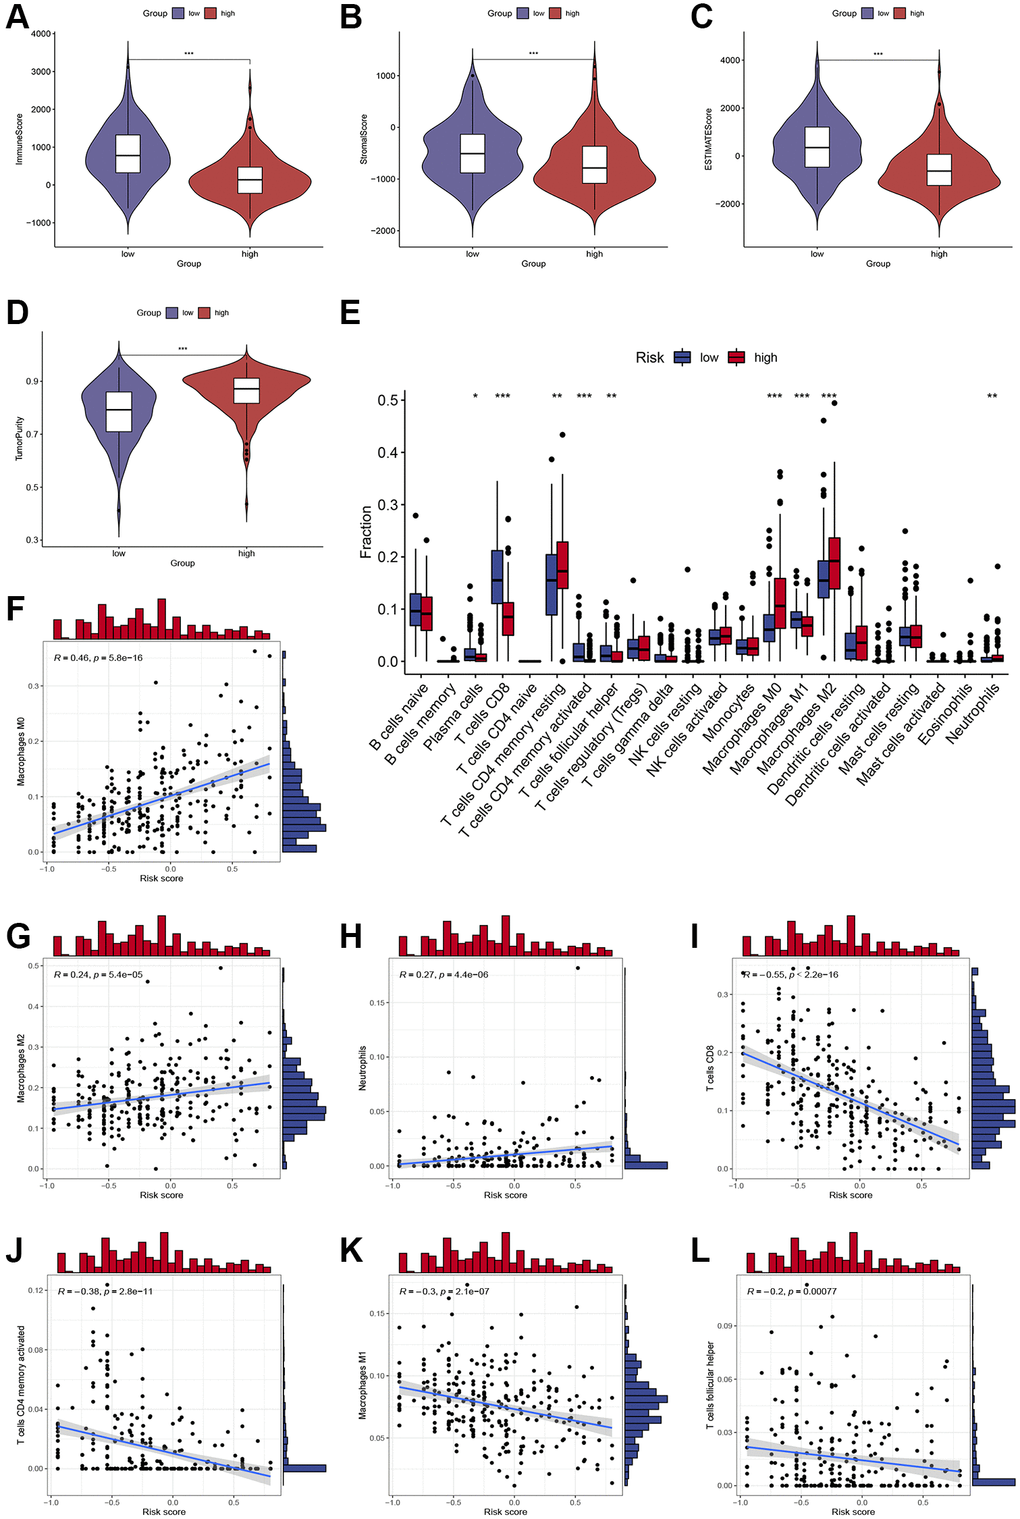
Figure 4.Assessment of immune cell infiltration and the immune microenvironment in different subgroups. (A–D) Differences in immune scores, stromal scores, and tumor purity between high-risk and low-risk groups. (E) Differences in immune cells infiltration between high-risk and low-risk groups. (F–L) Correlations between the risk score and immune cells infiltration. *, **, and *** represent p < 0.05, 0.01, and 0.001, respectively.