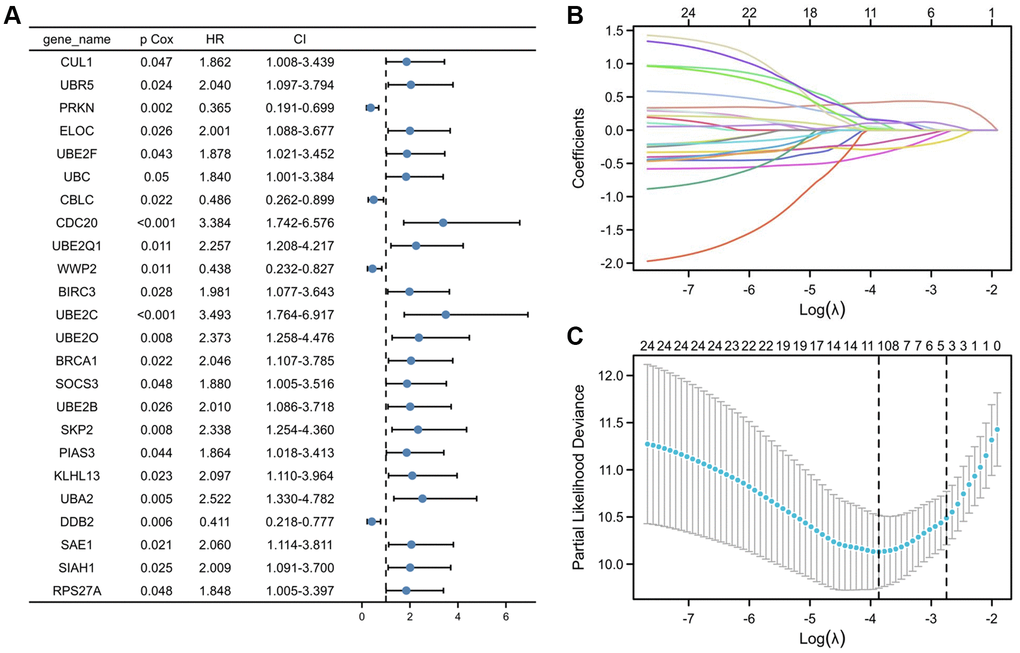
Figure 3.Selection of UPS genes associated with the survival of PRCC by univariate Cox regression analysis and Lasso regression analysis. (A) Forest plot of Pearson's correlation coefficients between 24 selected genes and patient survival in TCGA-PRCC. Values display in the left-hand column (P Cox). The hazard ratio (HR) is a comparison between the probability of events in cancer, associated with the probability of events in normal tissue. Every coefficient is shown as a point with a 95% confidence interval (CI). Dots represent the mean and CI of the random-effect model estimation; the horizontal line shows the prediction interval. (B) Lasso coefficient profiles of the 24 risk genes from univariate Cox regression analysis. The lines stand for the coefficient of Lasso. (C) Cross-validation for selecting risk genes for the LASSO model. The number on top of the plot displays the number of genes of each model. The two dotted vertical lines were drawn based on the optimal data according to the minimum criteria (left line) and 1se criteria (right line). The left vertical line represents the 10 genes finally identified. *P < 0.05, **P < 0.01, ***P < 0.001.