Submit an Article
Navigate
Home
Editorial Board
Editorial Policies
Current Volume
Archive
Scientific Integrity
Publication Ethics Statements
Interviews with Outstanding Authors
Newsroom
Sponsored Conferences
Podcast
Contact
Special Collections
Submit an Article
Online ISSN: 1945-4589
Research Paper
|
Volume 14, Issue 23
|
pp. 9423–9444
DNA methylation-based measures of biological aging and cognitive decline over 16-years: preliminary longitudinal findings in midlife
Back to article
Figure 1
(1 of 3)
−
100%
+
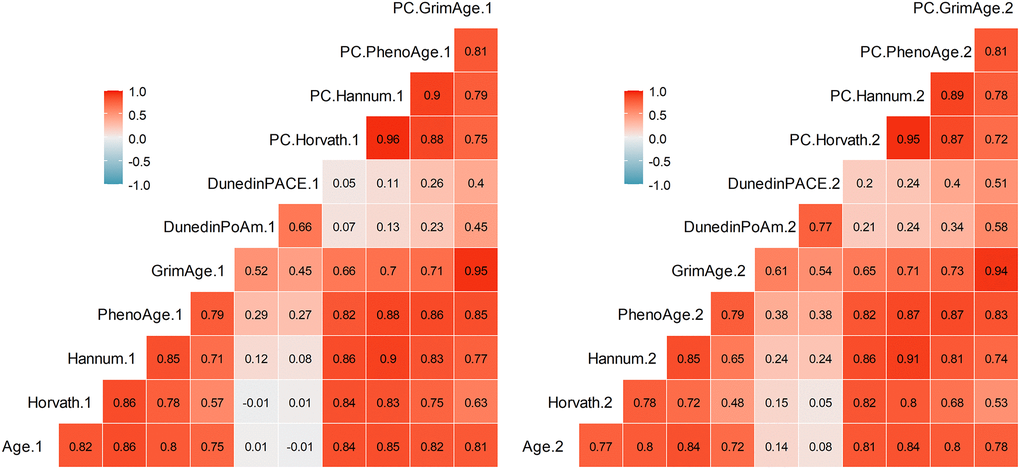
Figure 1.
Pearson correlations among DNAm measures at Time 1 (left) and Time 2 (right).
Correlations greater than
r
= .29 are statistically significant at
p
< .05.