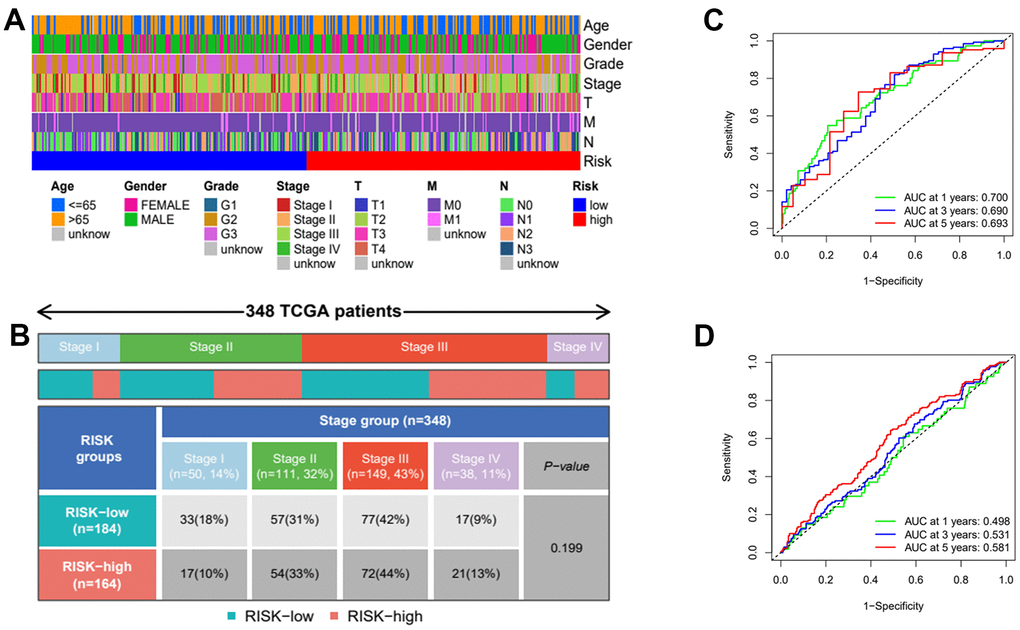
Figure 9.Clinical heatmap of risk scores and time-dependent ROC curve analysis. (A) Heatmap of risk scores under different clinical characteristics. (B) Distribution of high and low risk groups under different clinicopathological stages. (C) ROC curve analysis in TCGA. (D) ROC curve analysis in GEO.