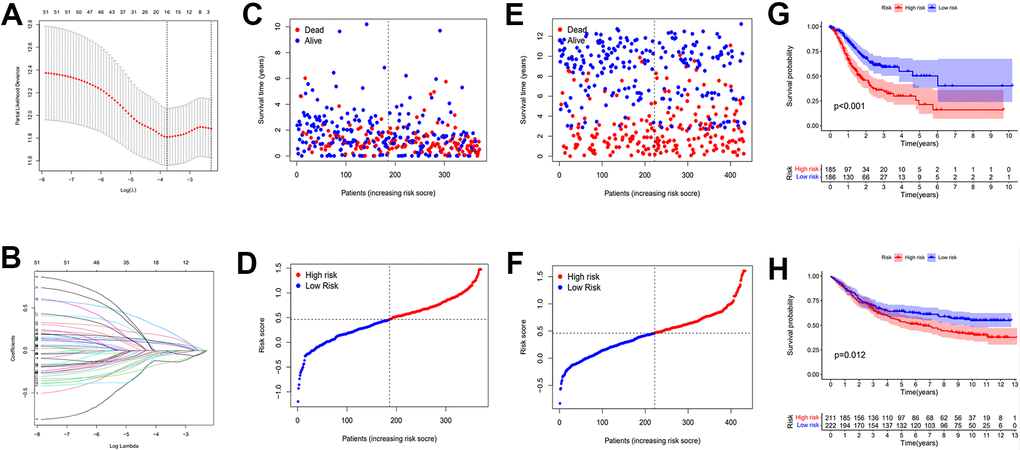
Figure 7.Establishment of risk prognostic model. (A) Partial likelihood deviance was plotted versus log (Lambda). The vertical dotted line indicates the lambda value with the minimum error and the largest lambda value. (B) LASSO coefficient profiles of the genes screening by univariate Cox regression analysis. (C, D) The distributions of risk scores and OS status in TCGA. (E, F) The distributions of risk scores and OS status in GEO. (G) The patient samples from TCGA were divided into high and low risk groups based on risk score and the OS of the groups were analyzed using Kaplan-Meier. (H) OS analysis of high and low risk groups from the GEO samples. Red represents the high risk group and blue represents the low risk group. LASSO: least absolute shrinkage and selection operator. OS: overall survival.