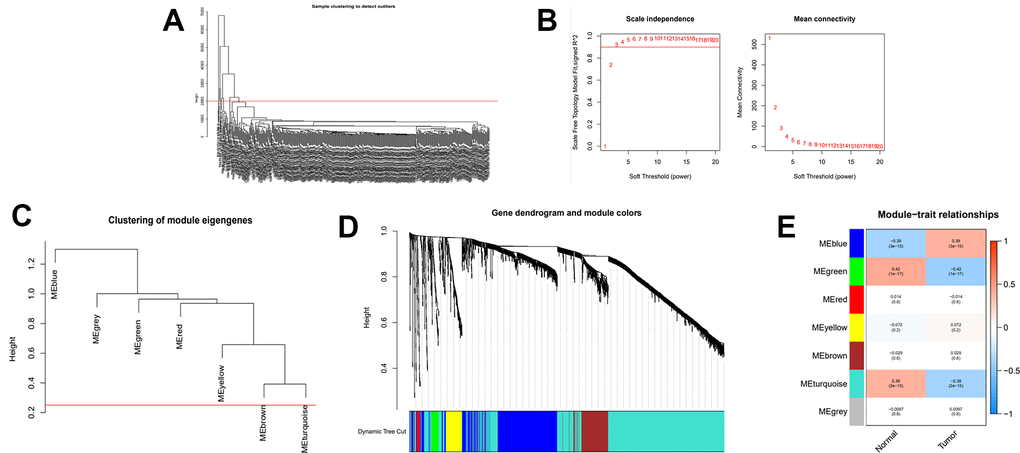
Figure 6.WGCNA analysis on the consensus clustering samples. (A) Samples above the red line were removed because they were considered as the deflection of gene expression. (B) This represents the correlation coefficient R2 and mean connectivity in the scale-free network. (C) Calculate similarity between modules and merge modules with high similarity. (D) Hierarchical clustering of gene modules. (E) Heatmap of the correlationship between gene modules and normal or cancer tissue.