Submit an Article
Navigate
Home
Editorial Board
Editorial Policies
Current Volume
Archive
Scientific Integrity
Publication Ethics Statements
Interviews with Outstanding Authors
Newsroom
Sponsored Conferences
Podcast
Contact
Special Collections
Submit an Article
Online ISSN: 1945-4589
Research Paper
|
Volume 14, Issue 23
|
pp. 9579–9598
MAGE-A3 regulates tumor stemness in gastric cancer through the PI3K/AKT pathway
Back to article
Figure 3
(3 of 13)
−
100%
+
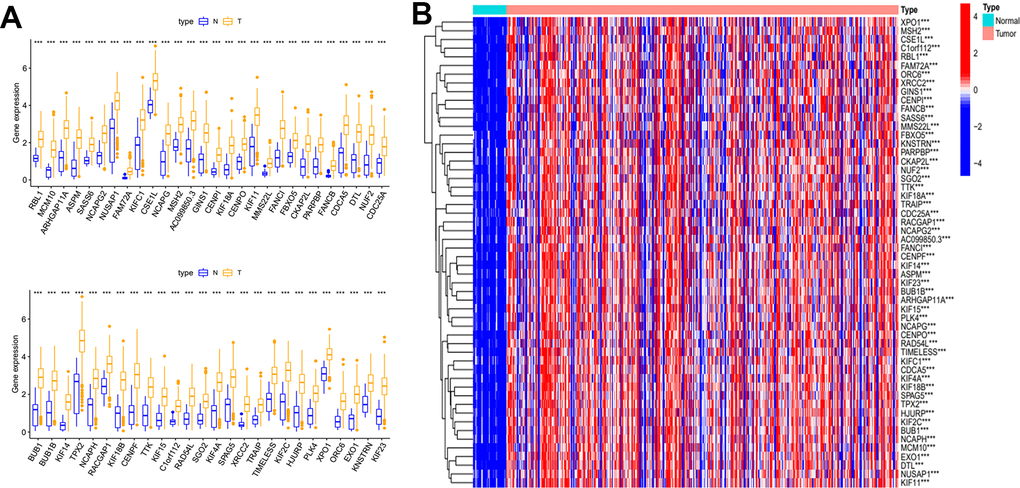
Figure 3.
Differential expression analysis of key genes.
(
A
) Box plot of the difference in expression of key genes between tumour and normal tissue. (
B
) Key genes differential expression heatmap.