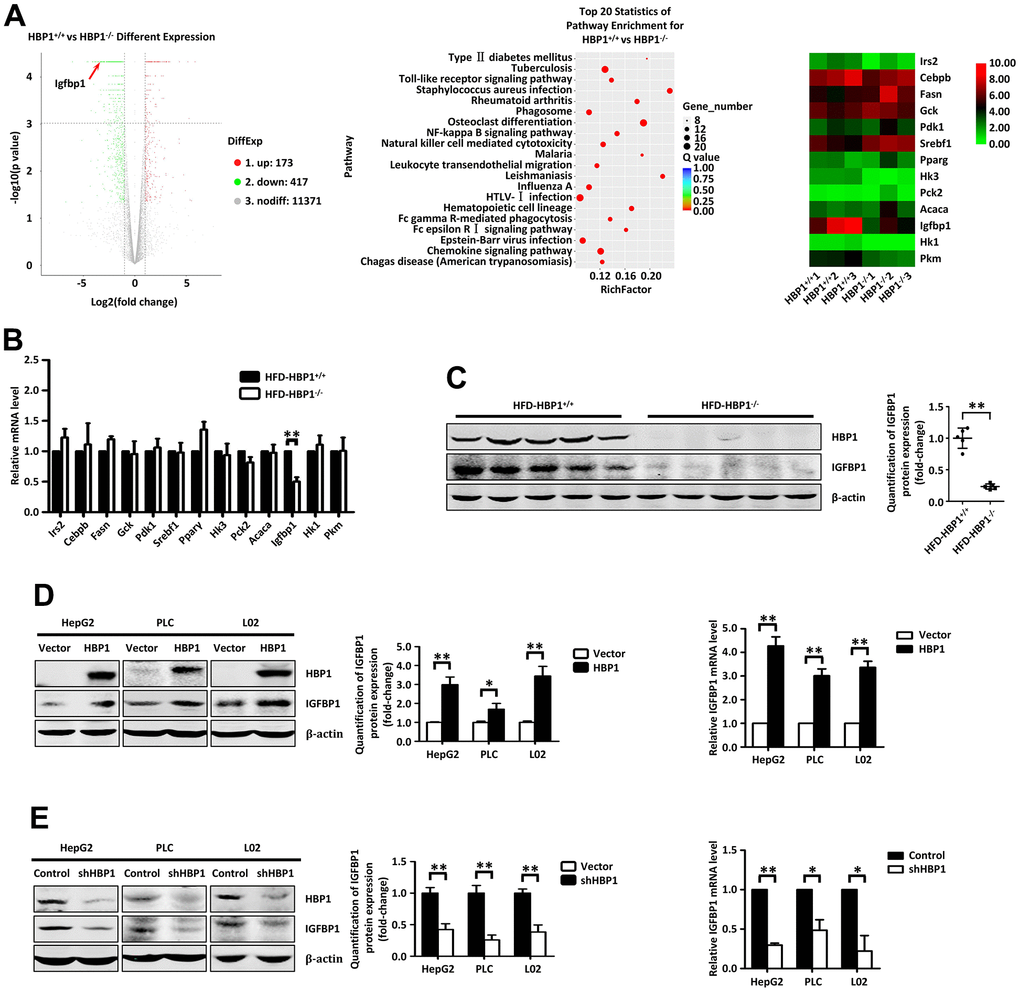
Figure 3.HBP1 increases the expression of IGFBP1 by binding to the IGFBP1 promoter. (A) RNA sequencing analysis of liver tissues from HBP1+/+ and HBP1−/− mice. (B) HBP1 affects the mRNA level of IGFBP1 in mouse liver tissues. The mRNA levels of Irs2, Cebpb, Fasn, Gck, Pdk1, Srebf1, Pparγ, Hk3, Pck2, Acaca, Igfbp1, Hk1 and Pkm2 were measured by real-time PCR in liver tissues from HBP1+/+ and HBP1−/− mice. (C) HBP1 affects the protein level of IGFBP1 in mouse liver tissues. The protein levels of HBP1 and IGFBP1 were measured by western blotting in liver tissues from HBP1+/+ and HBP1−/− mice. β-actin was used as a loading control. Quantification was normalized to β-actin, n = 5 mice per group. (D) HBP1 overexpression promotes both protein and mRNA expression of IGFBP1 in HepG2, PLC/PRF/5 and L02 cells. The cells were transfected with HA-HBP1 or pcDNA3 (as a control). The protein levels of HBP1 and IGFBP1 were measured by western blotting (left panel). β-actin was used as a loading control. Quantification was normalized to β-actin. The mRNA level of IGFBP1 was measured by real-time PCR (right panel). (E) HBP1 knockdown inhibits both protein and mRNA expression of IGFBP1 in HepG2, PLC/PRF/5 and L02 cells. The cells were stably transfected with pLL3.7-shHBP1 or pLL3.7 (as a control) through lentiviral infection. The protein levels of HBP1 and IGFBP1 were measured by western blotting (left panel). β-actin was used as a loading control. Quantification was normalized to β-actin. The mRNA level of IGFBP1 was measured by real-time PCR (right panel). Data were the mean ± SD by a two-tail, unpaired Student’s t-test. *, p<0.05. **, p<0.01.