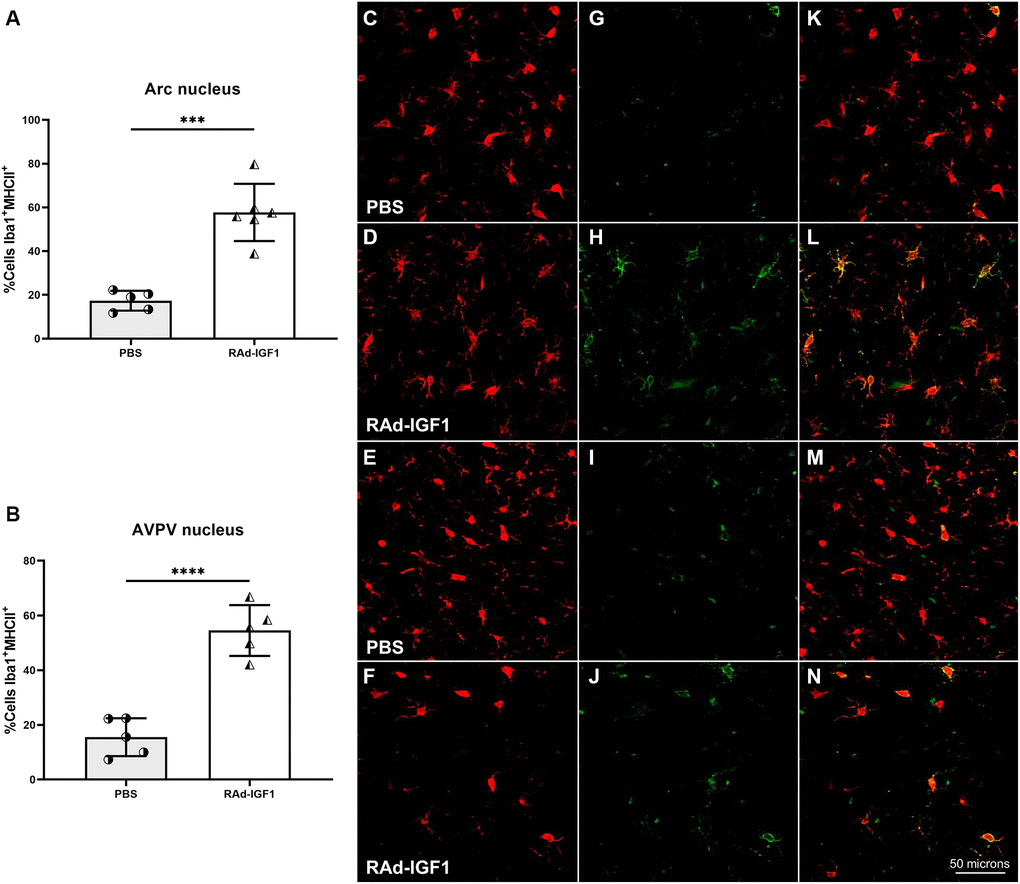
Figure 7.IGF1 gene therapy effect on the activation state of microglia. (A and B) Percentage of microglia presenting double immunostaining for Iba1 and MHCII. Error bars represent SD (Arcuate: NRAd-IGF1 = 6; NPBS = 5. AVPV: NRAd-IGF1 = 5; NPBS = 5). Two-tailed t-test was used. Asterisks indicate significant (***p < 0.0005; ****p < 0.0001) differences. Iba1 cells (C–F), MHCII cells (G–J) and colocalization of both markers (K–N) (Total magnification of 200×; scale bars: 50 microns). Figure 7A post hoc power (1-β) analysis: 0.99997; Figure 7B post hoc power (1-β) analysis: 0.999997.
Figure 7 — IGF1 gene therapy in middle-aged female rats delays reproductive senescence through its effects on hypothalamic GnRH and kisspeptin neurons | Aging