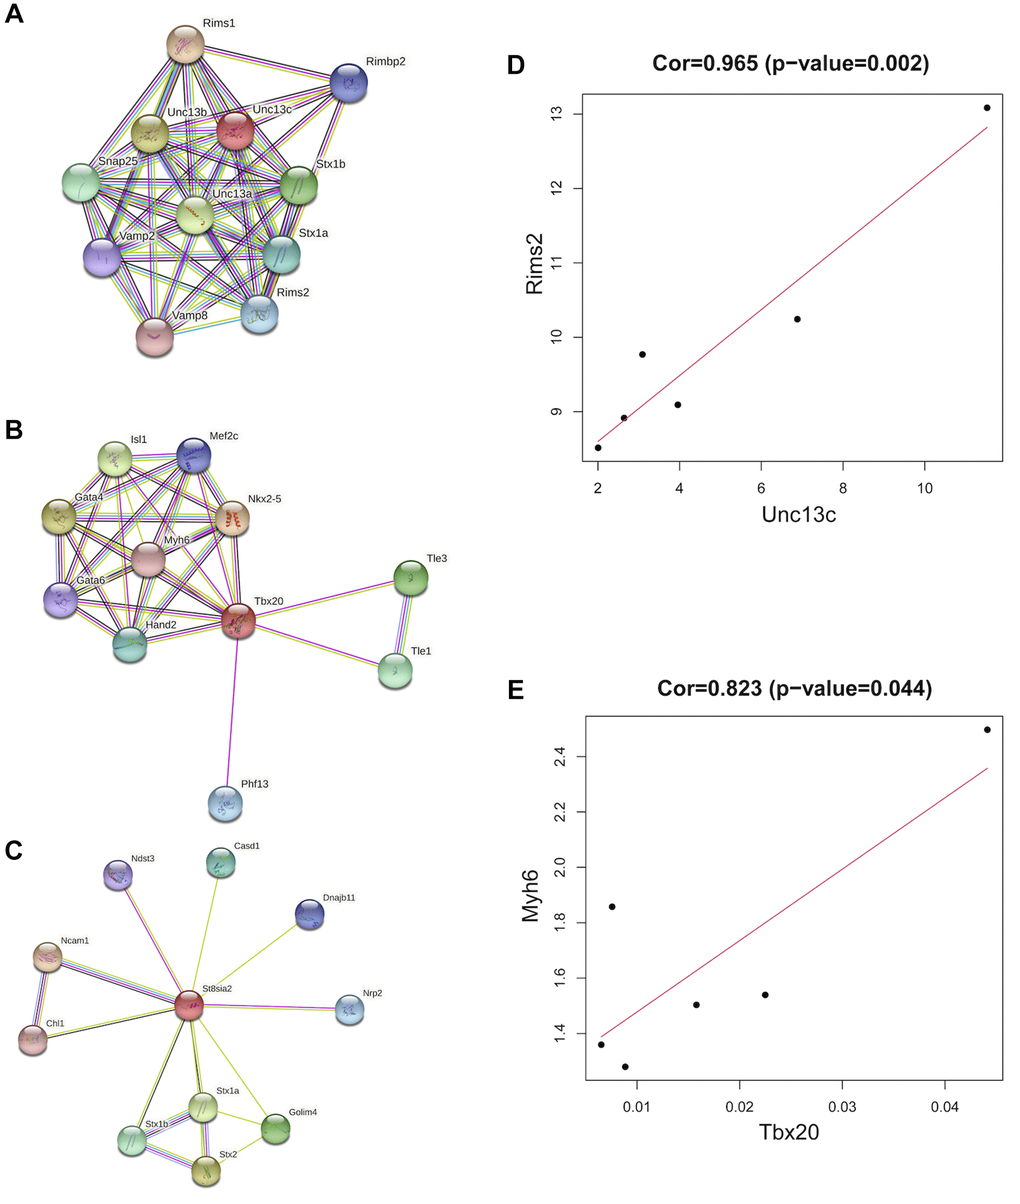
Figure 8.Co-expression of hub genes. (A) The PPI network plot for Unc13c, including co-expression of 10 predicted genes with Unc13c. (B) The PPI network plot for Tbx20, including co-expression of 10 predicted genes with Tbx20. (C) The PPI network plot for St8sia2, including co-expression of 10 predicted genes with St8sia2. (D) The correlation of Unc13c and Rimsa (E) The correlation of Tbx20 and Myh6.