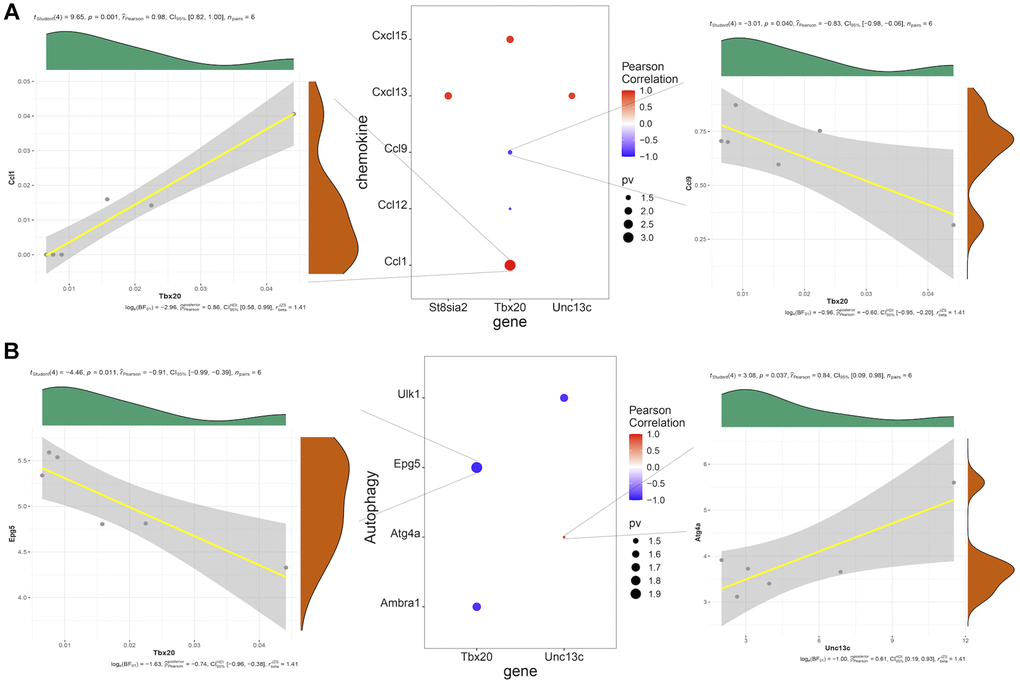
Figure 6.(A) Pearson correlation analysis of hub genes and chemokines, in which red represents positive correlation, blue represents negative correlation, and the size of point represents the size of P-value. (B) Pearson correlation analysis of hub genes and autophagy-related factors, in which red represents positive correlation, blue represents negative correlation, and the size of dot represents the size of P-value.