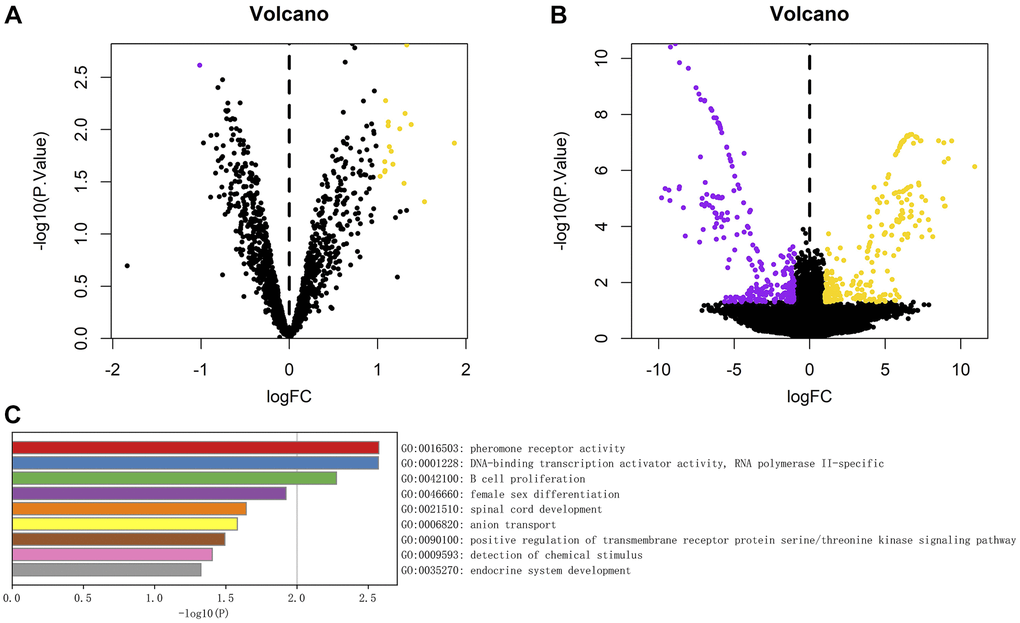
Figure 3.(A) Volcanic diagram of differential analysis of circRNA; (B) Volcanic map of mRNA differences detected in the experiment. The yellow dot represents the up-regulated genes, the purple dot represents the down-regulated genes, the abscissa is the log2 change multiple, and the ordinate is P-value. (C) Analysis of enrichment function of 530 differentially expressed genes, The length of the column represents the size of P-value.